Hypothesis #15 of 20
Where were the skilled hands?
Strength is how much of our gathered material lines up with the pattern. It is not the odds that the idea is true.
The working idea
Where the record does name the workforce, it keeps saying the same thing: the skills had to be imported (Scottish granite cutters, German and Irish masons) or forced (convicts). Yet the same decades are credited with thousands of carved stone buildings across small towns. Common sense: if Texas had to send to Scotland for 86 stonecutters, who was cutting stone for every county courthouse and capitol at the same time? One possibility is that far fewer buildings were cut new than the record implies, and many crews were finishing, repairing or refacing existing stonework.
Strongest examples

The evidence
Workforce, material or tonnage facts on record that strain a local workforce
14
14 entries
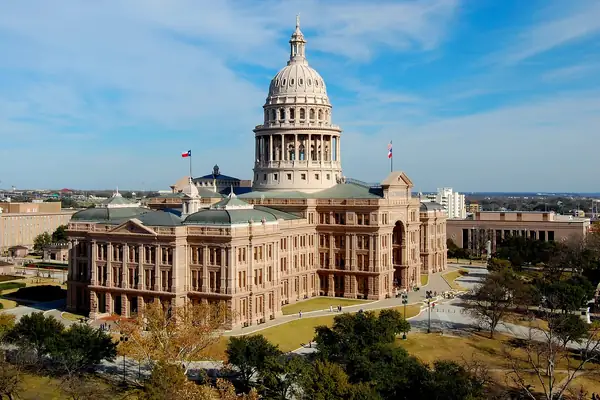 Texas State Capitol86 granite cutters from Scotland among 900; up to 1,000 convicts and migrants
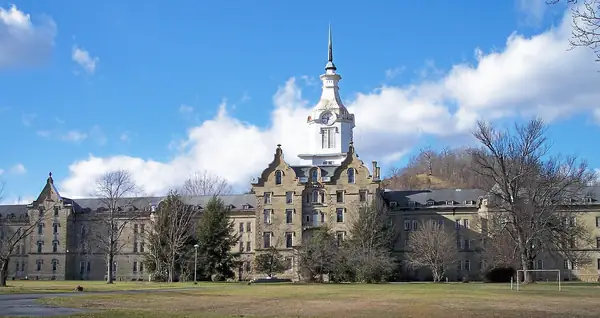 Trans-Allegheny Lunatic Asylummasons from Germany and Ireland
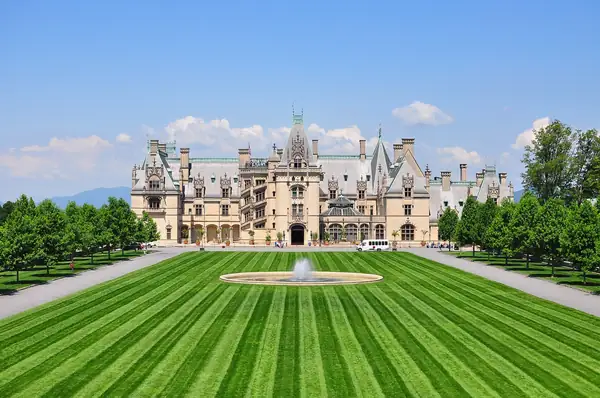 Biltmore House60 stonemasons for 178,926 sq ft = about 2,982 sq ft per mason
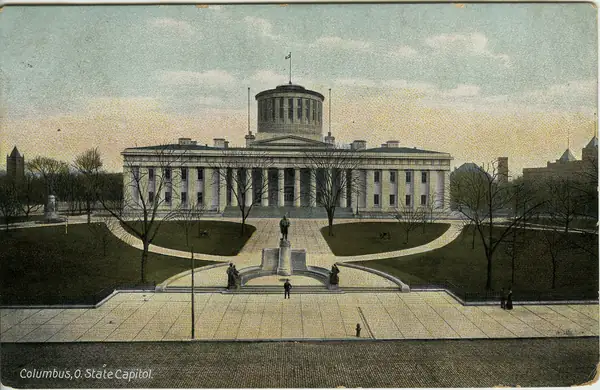 Ohio Statehouseprisoners quarried and hauled limestone
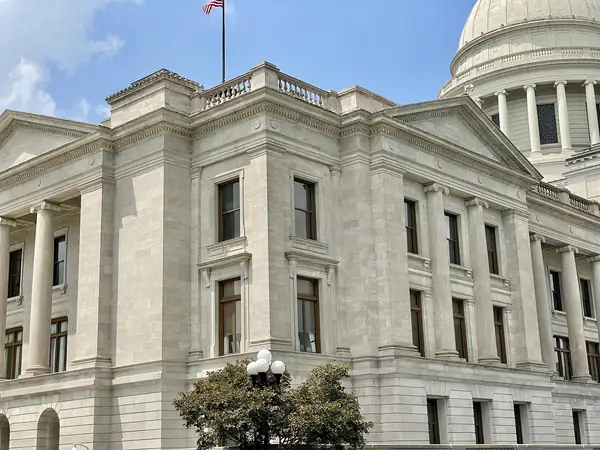 Arkansas State Capitolconvict labour at the start
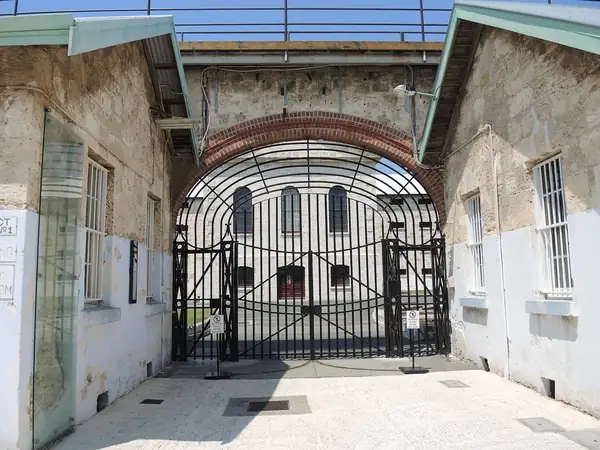 Fremantle Prisonbuilt by convicts
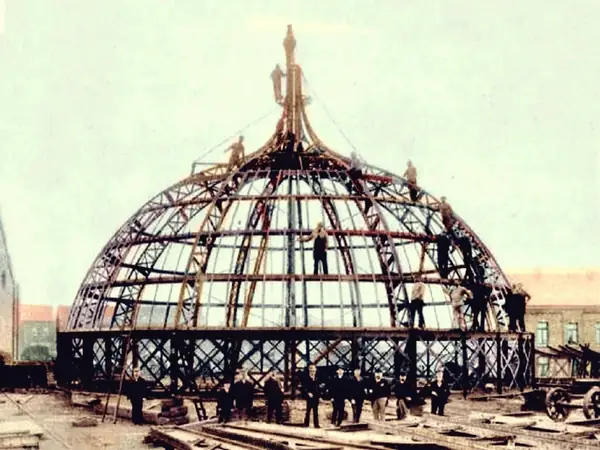 Teatro Amazonasimported European materials
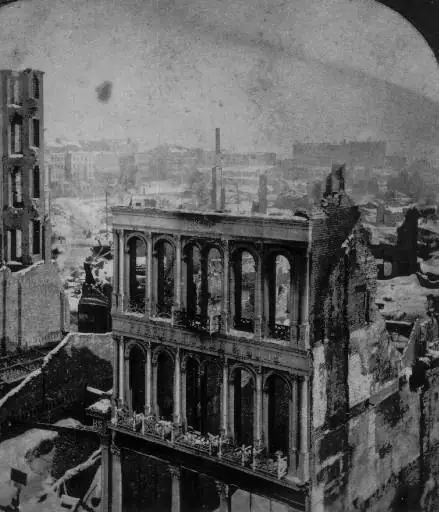 Boston financial district rebuild776 buildings back in under 2 years
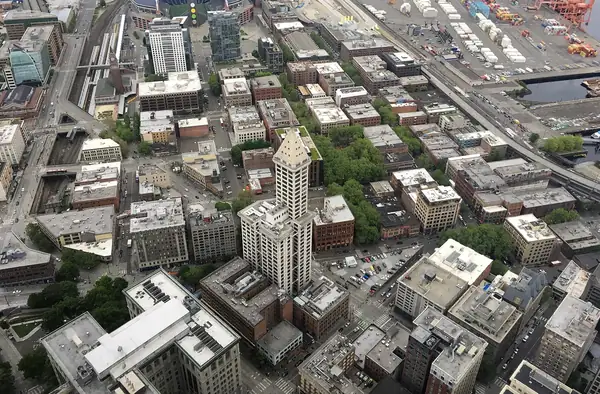 Seattle's Pioneer Squaredozens of stone buildings in about 18 months
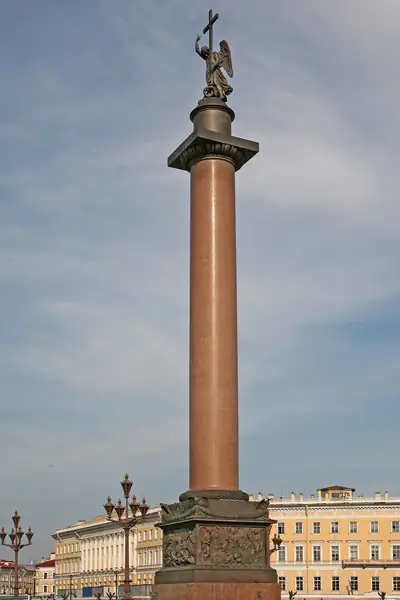 Alexander Column600-tonne monolith raised by 3,000 men in under 2 hours
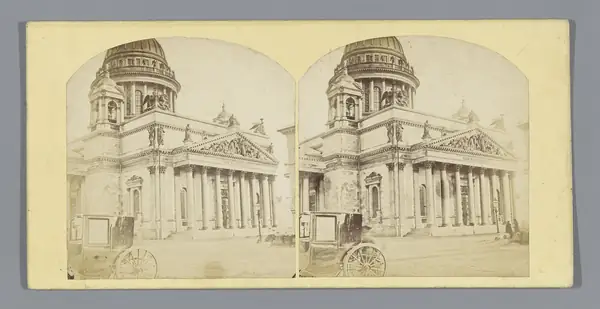 Saint Isaac's Cathedralsingle-piece granite columns raised with capstans
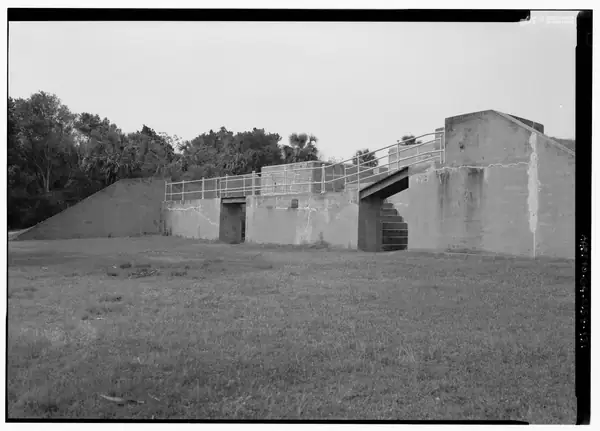 Fort Pulaskiabout 25 million bricks on a marsh island
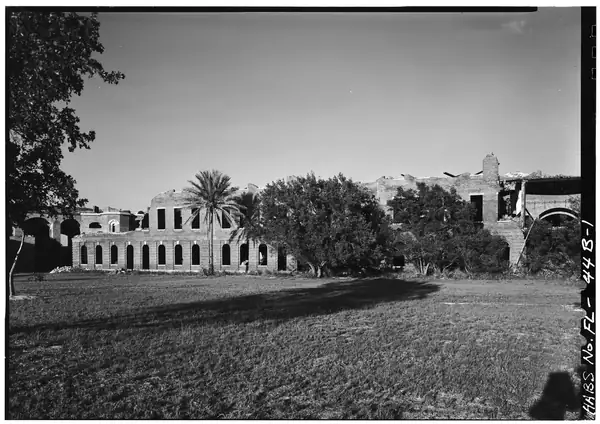 Fort Jeffersonabout 16 million bricks on a coral key 70 miles out
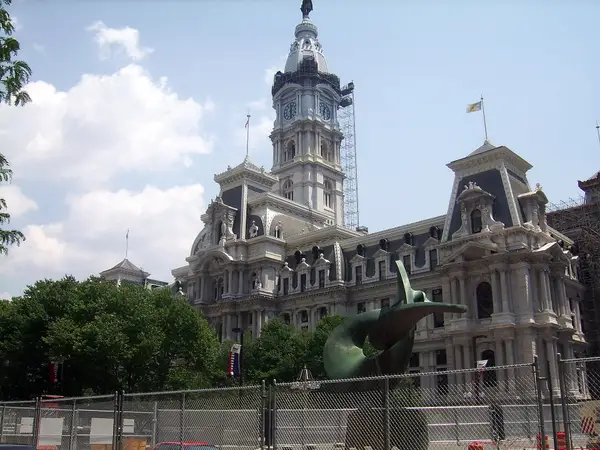 Philadelphia City Hall250 sculptures; 'where were the carvers trained?'
'Does it add up?' scores with a mason factor
Texas masons 7 → 9 and Biltmore 3 → 4 under the proposed census sub-rule (see mismatchUpdates); Trans-Allegheny unchanged at 4
Recorded crews against the census
Texas: 86 Scottish cutters = 5.2% of all 1,668 masons and stonecutters in Texas (1880), and 20.2% of the state's 426 marble and stone cutters in 1900. Biltmore: 60 stonemasons = 3.4% of North Carolina's 1,756 masons (1900).
Brick arithmetic (cited rate: 800 to 1,000 common bricks per mason per day)
Fort Pulaski 25 million bricks = 25,000–31,250 mason-days of laying; 1,389–1,736 mason-days a year if spread evenly over 18 years. Fort Jefferson 16 million = 16,000–20,000 mason-days of laying; 552–690 mason-days a year if spread evenly over 29 years.
Laying only; see laborEstimates for what this leaves out.
Stonecutters are the thin trade, not masons
Among the pair states in 1900, marble and stone cutters number 41 (Mississippi), 44 (Idaho), 138 (Montana), 155 (Oregon), 238 (Washington), 426 (Texas), against 186 (Idaho) to 1,909 (Texas) 'masons' proper in the same six states. The 1880 tables don't separate them.
1 entries
- Occupations/1900-Table-32US Census
What the census says
Counts of carpenters, masons, stonecutters, plasterers and iron workers, read from the printed US Census occupation tables. State counts cover the whole state, not the town.
Where it cuts against the hypothesis
- Still emerging (14). The census adds context rather than support: masons were plentiful at state level; the open part is skilled cutting and carving, and town-level crews.
- State census counts already show large pools of masons (hundreds to tens of thousands per state, 1880 and 1900) and carpenters, so a general shortage of builders is not supported at state level.
- Where a crew is recorded (Texas, Biltmore) it is a small share of the state's masons, and the brick arithmetic for the two big forts works out to a modest crew over the recorded years.
Crews and the census
Brick rate used: A mason in one day will lay from 800 to 1,000 common bricks, or 300 to 400 face bricks. Source ↗
- Fort PulaskiCockspur Island, Georgia
25,000–31,250 mason-days of laying; 1,389–1,736 mason-days a year if spread evenly over 18 years.
On the brick count alone the job is large but not beyond a modest crew over the recorded years. The open questions for these forts are the sites (marsh island, coral key 70 miles out) and where the bricks were made, not the laying rate.
Counts laying only, at the common-brick rate. It leaves out brickmaking, shipping, mortar, foundations, arches and the labourer each mason needs. No working-days-per-year figure is applied, so this is not turned into a crew size. Census counts of masons in Georgia (1829–47) and Florida (1846–75) were not sourced, so no local comparison is made.
- Fort JeffersonDry Tortugas, Florida
16,000–20,000 mason-days of laying; 552–690 mason-days a year if spread evenly over 29 years.
On the brick count alone the job is large but not beyond a modest crew over the recorded years. The open questions for these forts are the sites (marsh island, coral key 70 miles out) and where the bricks were made, not the laying rate.
Counts laying only, at the common-brick rate. It leaves out brickmaking, shipping, mortar, foundations, arches and the labourer each mason needs. No working-days-per-year figure is applied, so this is not turned into a crew size. Census counts of masons in Georgia (1829–47) and Florida (1846–75) were not sourced, so no local comparison is made.
- Texas State CapitolAustin
- Texas, 1880: 1,668 brick and stone masons, marble and stone cutters in the whole state (1880 Table XXXIV, printed p. 847). 86 imported cutters = 5.2% of that count.
- Texas, 1900: 426 marble and stone cutters statewide (1900 Table 32). 86 = 20.2% of the 1900 cutters, twelve years after the capitol was finished.
Texas did have stoneworkers (1,668 masons and cutters in 1880), yet the builders still brought 86 cutters from Scotland. That fits a shortage of granite cutters specifically, not of masons in general.
- Biltmore HouseAsheville, North Carolina
- North Carolina, 1900: 1,756 masons (brick and stone) and 415 marble and stone cutters statewide (1900 Table 32). 60 stonemasons = 3.4% of the state's 1900 masons. (1890 North Carolina figures not sourced.)
- Biltmore is Indiana limestone, not brick, so no brick-rate estimate is made.
A crew of 60 is a small share of the state's masons.
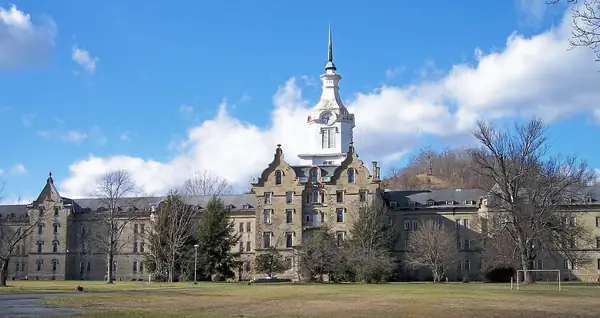 Trans-Allegheny Lunatic AsylumWeston, West Virginia
- West Virginia, 1880: 1,059 brick and stone masons, marble and stone cutters statewide; Weston itself had 1,516 people (1880 census, https://en.wikipedia.org/wiki/Weston,_West_Virginia). Weston town counts not sourced.
- West Virginia, 1900: 1,626 masons and 499 marble and stone cutters statewide.
No crew size is recorded, so no ratio can be made.
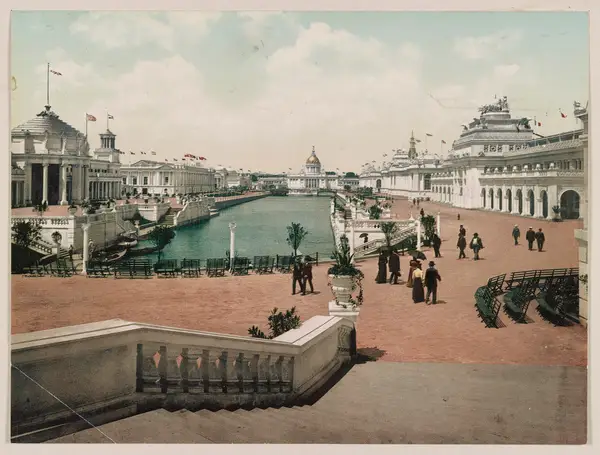 Trans-Mississippi and International ExpositionOmaha 1898
- Omaha city, 1900 (males): 1,364 carpenters and joiners, 423 masons (brick and stone), 139 plasterers, 94 marble and stone cutters, 244 iron and steel workers (1900 Table 43, printed pp. 664 and 666).
- Nebraska, 1900: 7,329 carpenters, 1,701 masons, 692 plasterers statewide.
The fair palaces were staff (plaster and fibre) over frames, so carpenters and plasterers are the relevant trades. Without a recorded crew size there is nothing to divide.
31 census counts, by state and city
California 1880
9,056 carpenters1,565 masons and stonecutters1,099 iron and steel workers
Tenth Census of the United States (1880), Vol. 1, Statistics of the Population, p. 811 ↗Colorado 1880
3,773 carpenters1,166 masons and stonecutters177 iron and steel workers
carpenters: first digit 3 or 8 is hard to tell apart in this scan; 3,773 is read, and fits Colorado's 1900 figure of 5,592
Tenth Census of the United States (1880), Vol. 1, Statistics of the Population, p. 812 ↗Illinois 1880
22,972 carpenters7,535 masons and stonecutters6,283 iron and steel workers
Tenth Census of the United States (1880), Vol. 1, Statistics of the Population, p. 820 ↗Kansas 1880
7,119 carpenters2,999 masons and stonecutters618 iron and steel workers
Tenth Census of the United States (1880), Vol. 1, Statistics of the Population, p. 823 ↗Michigan 1880
16,541 carpenters4,412 masons and stonecutters2,868 iron and steel workers
Tenth Census of the United States (1880), Vol. 1, Statistics of the Population, p. 829 ↗New York 1880
49,754 carpenters23,893 masons and stonecutters16,261 iron and steel workers
Tenth Census of the United States (1880), Vol. 1, Statistics of the Population, p. 839 ↗Ohio 1880
29,770 carpenters10,713 masons and stonecutters13,419 iron and steel workers
Tenth Census of the United States (1880), Vol. 1, Statistics of the Population, p. 841 ↗Oregon 1880
1,899 carpenters312 masons and stonecutters97 iron and steel workers
carpenters: 1,899 read; the 8 could be a 3 in this scan (1,399)
Tenth Census of the United States (1880), Vol. 1, Statistics of the Population, p. 842 ↗Texas 1880
5,693 carpenters1,668 masons and stonecutters155 iron and steel workers
Tenth Census of the United States (1880), Vol. 1, Statistics of the Population, p. 847 ↗West Virginia 1880
3,205 carpenters1,059 masons and stonecutters1,517 iron and steel workers
carpenters: 3,205 read; the first digit could be an 8 in this scan, but 8,205 would be above the 1900 figure of 6,485
Tenth Census of the United States (1880), Vol. 1, Statistics of the Population, p. 852 ↗Arkansas 1900
4,192 carpenters671 masons (brick and stone)639 masons (line only)160 marble and stone cutters102 plasterers181 iron and steel workers
Twelfth Census of the United States (1900), Special Reports: Occupations (1904), p. 98, 100 ↗California 1900
15,916 carpenters1,774 masons (brick and stone)1,661 masons (line only)960 marble and stone cutters736 plasterers3,102 iron and steel workers
Twelfth Census of the United States (1900), Special Reports: Occupations (1904), p. 98, 100 ↗Colorado 1900
5,592 carpenters1,390 masons (brick and stone)1,249 masons (line only)407 marble and stone cutters388 plasterers1,475 iron and steel workers
Twelfth Census of the United States (1900), Special Reports: Occupations (1904), p. 98, 100 ↗Georgia 1900
9,479 carpenters1,914 masons (brick and stone)1,864 masons (line only)964 marble and stone cutters370 plasterers923 iron and steel workers
Twelfth Census of the United States (1900), Special Reports: Occupations (1904), p. 98, 100 ↗Idaho 1900
1,265 carpenters191 masons (brick and stone)186 masons (line only)44 marble and stone cutters42 plasterers37 iron and steel workers
Twelfth Census of the United States (1900), Special Reports: Occupations (1904), p. 99, 101 ↗Kentucky 1900
10,216 carpenters2,359 masons (brick and stone)2,087 masons (line only)699 marble and stone cutters808 plasterers3,889 iron and steel workers
Twelfth Census of the United States (1900), Special Reports: Occupations (1904), p. 99, 101 ↗Lincoln, Nebr. 1900 · city · males
481 carpenters168 masons (brick and stone)52 plasterers
Twelfth Census (1900), Special Reports: Occupations (1904), p. 449 ↗Minnesota 1900
15,191 carpenters4,061 masons (brick and stone)3,940 masons (line only)1,139 marble and stone cutters804 plasterers1,889 iron and steel workers
Twelfth Census of the United States (1900), Special Reports: Occupations (1904), p. 99, 101 ↗Mississippi 1900
4,475 carpenters694 masons (brick and stone)663 masons (line only)41 marble and stone cutters76 plasterers154 iron and steel workers
Twelfth Census of the United States (1900), Special Reports: Occupations (1904), p. 99, 101 ↗Missouri 1900
21,540 carpenters6,147 masons (brick and stone)5,356 masons (line only)1,520 marble and stone cutters1,966 plasterers5,440 iron and steel workers
Twelfth Census of the United States (1900), Special Reports: Occupations (1904), p. 108, 110 ↗Montana 1900
2,831 carpenters572 masons (brick and stone)535 masons (line only)138 marble and stone cutters141 plasterers260 iron and steel workers
Twelfth Census of the United States (1900), Special Reports: Occupations (1904), p. 108, 110 ↗Nebraska 1900
7,329 carpenters1,701 masons (brick and stone)1,614 masons (line only)284 marble and stone cutters692 plasterers472 iron and steel workers
Twelfth Census of the United States (1900), Special Reports: Occupations (1904), p. 108, 110 ↗North Carolina 1900
8,067 carpenters1,756 masons (brick and stone)1,658 masons (line only)415 marble and stone cutters259 plasterers458 iron and steel workers
Twelfth Census of the United States (1900), Special Reports: Occupations (1904), p. 108, 110 ↗Omaha, Nebr. 1900 · city · males
1,364 carpenters423 masons (brick and stone)94 marble and stone cutters139 plasterers244 iron and steel workers
Twelfth Census (1900), Special Reports: Occupations (1904), p. 664, 666 ↗Oregon 1900
4,357 carpenters573 masons (brick and stone)541 masons (line only)155 marble and stone cutters164 plasterers455 iron and steel workers
Twelfth Census of the United States (1900), Special Reports: Occupations (1904), p. 109, 111 ↗Seattle, Wash. 1900 · city · males
left blank: this column is too faint in the census.gov scan to read single digits (carpenters 1,8?0, masons 2?0, plasterers 11?)
Twelfth Census (1900), Special Reports: Occupations (1904), p. 469 ↗Springfield, Ill. 1900 · city · males
145 masons (brick and stone)48 plasterers
carpenters left blank: the scan reads 608, 603 or 508
Twelfth Census (1900), Special Reports: Occupations (1904), p. 469 ↗Texas 1900
12,433 carpenters2,020 masons (brick and stone)1,909 masons (line only)426 marble and stone cutters242 plasterers745 iron and steel workers
Twelfth Census of the United States (1900), Special Reports: Occupations (1904), p. 109, 111 ↗Topeka, Kans. 1900 · city · males
609 carpenters137 masons (brick and stone)52 plasterers
faint print; column order on the page is Taunton, Terre Haute, Toledo, Topeka
Twelfth Census (1900), Special Reports: Occupations (1904), p. 473 ↗Washington 1900
7,671 carpenters1,036 masons (brick and stone)1,014 masons (line only)238 marble and stone cutters345 plasterers596 iron and steel workers
Twelfth Census of the United States (1900), Special Reports: Occupations (1904), p. 109, 111 ↗West Virginia 1900
6,485 carpenters1,626 masons (brick and stone)1,564 masons (line only)499 marble and stone cutters354 plasterers2,200 iron and steel workers
Twelfth Census of the United States (1900), Special Reports: Occupations (1904), p. 109, 111 ↗
What the census volumes could not tell us
Town- or county-level counts for the small towns (Weston, Athens, Fergus Falls, Traverse City, Ovid/Willard, Napa, Salem OR, Milledgeville, Lansing, Austin, Jackson, Boise, Olympia, Helena, Frankfort, Jefferson City, Leadville, Asheville) in any year 1850–1900
The printed census volumes only break occupations down by city for the largest cities (1870 and 1880: 50 principal cities; 1890: cities of 25,000+ in Table 118; 1900: cities of 25,000+ in Table 42). None of these towns was big enough. County counts would need IPUMS full-count microdata, which needs an account, so they are left blank.
1850, 1860 and 1870 state counts
The 1870 census.gov PDFs we downloaded (1870a-34 to 40) have no text layer and were not read page by page in this pass; 1850 and 1860 volumes were not downloaded. Left blank.
1890 state and city counts
The 1890 Population Part II volumes were downloaded, but their state occupation tables did not come through in the text layer and were not read from images in this pass. Table 118 (cities of 50,000+) is in section 5; of the pair towns only Omaha and Lincoln were that size in 1890, and the table was not read from images in this pass. Left blank.
Seattle 1900 city counts; Springfield 1900 carpenters
Too faint in the census.gov scan to read every digit (see 'legibility').
Stone carvers and bricklayers as separate trades
Neither is its own line in these tables: bricklayers fall inside 'Masons (brick and stone)', and carvers are not split out from 'Marble and stone cutters'. Left blank rather than guessed.
UK and Canada equivalents (e.g. Holloway Sanatorium, Colney Hatch, Ottawa, Victoria BC)
Not sourced in this pass. Left blank.
Open questions
- State counts are now in. What were the town and county counts of masons, stonecutters and carvers in the build years (IPUMS full-count data)?
- Where were the training yards for the carvers of 250 City Hall sculptures?
- Why do the few named workforces look so small for the job?
What would support it
- Town or county occupation counts far below what the square footage needs, with no record of camps or imported crews.
- Few or no apprenticeship and guild records for carvers in the towns that got the most ornate buildings.
- Stonecutter counts (the thin trade in 1900) that stay small through the years when the most carved stone went up.
What would rule it out
- State census counts already show large pools of masons (hundreds to tens of thousands per state, 1880 and 1900) and carpenters, so a general shortage of builders is not supported at state level.
- Where a crew is recorded (Texas, Biltmore) it is a small share of the state's masons, and the brick arithmetic for the two big forts works out to a modest crew over the recorded years.
- Well-documented travelling contractors and pre-cut stone shipped by rail from big quarry towns.
Selection bias
Medium: workforce facts are only recorded for some buildings, so this is a sample of the cases where someone wrote it down.
The rating counts how much of our gathered material lines up with the pattern. It is not a probability that the hypothesis is true, and every count is limited by which buildings were picked for the app (see 'selectionBias' on each card).
Next hypothesis
 Emerging13 entries#16The records go with the fireAgain and again, the fire that takes a building also takes the papers: city archives, land records, a state library, a nation's record office, the census for the fair years. Common sense says if you wanted to know who held the land, who lived there and who built what, these are exactly the records you'd need, and they're exactly the ones that are gone. The possibility is that the gaps in the record are not random.