Hypothesis #8 of 20
Repopulation after the Mud Flood? Testing the timeline
Strength is how much of our gathered material lines up with the pattern. It is not the odds that the idea is true. Strong by count (65) after the second-batch rows, but kept at moderate: the timing overlap in 1850–1920 is strong, while the order the hypothesis needs (deposit first, repopulation after) is still not supported by our dated items.
The working idea
The idea Chris asked us to test: if something buried or emptied cities, you'd expect the evidence of burial and dig-out to come first, then a rush to fill the buildings and the land with people: orphan trains, new orphanages and asylums, child workers, incubator babies on show at the fairs, and big immigration waves. We lined up every dated item we've gathered, decade by decade (the 'overlay' block in this file). The repopulation signals really do bunch together in 1850–1920, alongside the fires and the fairs. The weak spot is the order: in our data the mud-flood evidence (street raisings) starts in the same decade as the orphan trains, not before them.
Strongest examples
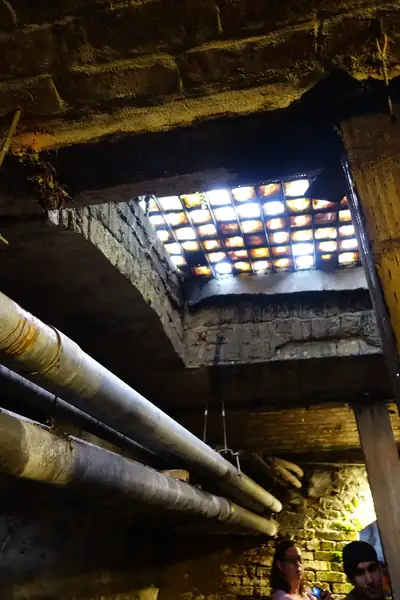 Seattle UndergroundBuried storey after 1889; Seattle grew from 3,533 (1880) to 42,837 (1890) (census, https://en.wikipedia.org/wiki/Seattle).
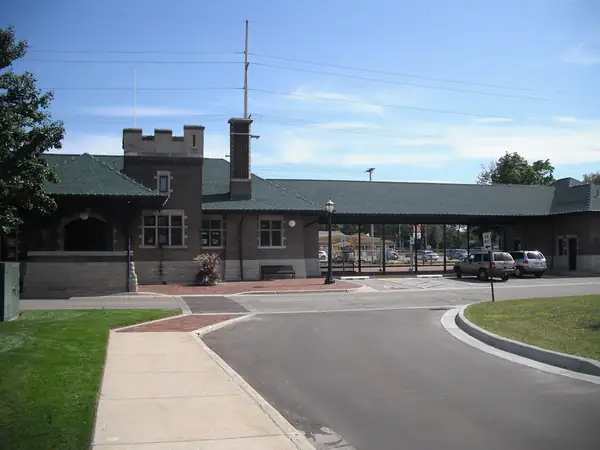 First orphan train stop, Dowagiac1854: children dropped off at a depot in a town of 1,181 (1860 census, https://en.wikipedia.org/wiki/Dowagiac,_Michigan). Round 2 adds dated riders and towns from Iowa City to Opelousas.
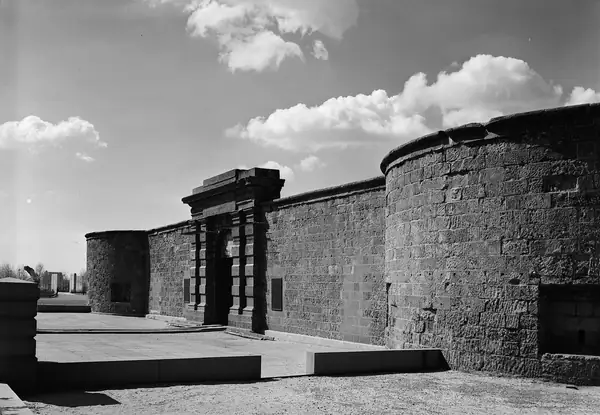 Castle Garden immigrant depotMore than 7.5 million arrivals in 35 years through one depot.
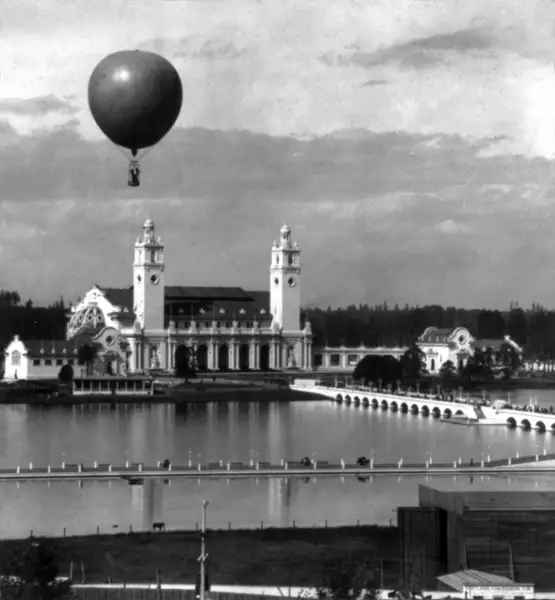 incubators/portland-1905The 'Infant incubator building' at the 1905 Portland fair (fair-photos-add, portland-1905/154).
The combined timeline
Each row is one kind of record, counted by decade. Darker cells hold more entries.
Refreshed decade-by-decade overlay (hypotheses-this update). Built from the final the second research batch.json as merged at 22:26:46 EDT. Each series: byDecade = number of events (or active ranges spanning that decade) in decades 1700–1990; refsByDecade lists which entries fall in each decade. Counts are of what we gathered, not of everything that happened.
Tap a shaded cell to list the entries behind it.
The evidence
What lines up: share of each series falling in 1850–1919 (refreshed with the final second-batch data)
Expositions 23 of 25; child-labour records 32 of 34; asylum openings 134 of 185 (72%), peak 1860s with 29; orphanages and child institutions 61 of 93 (66%); orphan-train riders, towns and depots 20 of 20; great fires 44 of 68 (65%), peaks 1880s and 1900s with 10 each; street raisings: 8 of 9 active between 1855 and 1930; incubator shows 1896–1943
11 entries
- overlay/series/streetRaising
- overlay/series/digOut
- overlay/series/fires
- overlay/series/expositions
- overlay/series/asylumOpenings
- overlay/series/orphanages
- overlay/series/orphanTrainRecords
- overlay/series/childLabor
- overlay/series/childMovement
- overlay/series/immigration
- overlay/series/incubators
The 1850s–1860s start: everything switches on in the same two decades
First 19th-century street raising (Chicago, 1850s); orphan trains begin 1854; Castle Garden opens 1855; asylum openings 14 (1840s) → 17 (1850s) → 29 (1860s); orphanage foundings 3 (1840s) → 12 (1850s) → 13 (1860s); 7 of the 20 dated orphan-train rider and town rows are in the 1850s
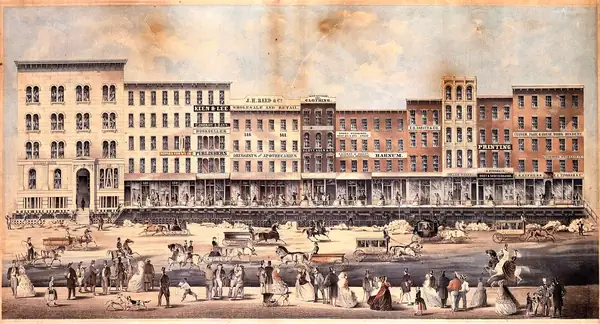

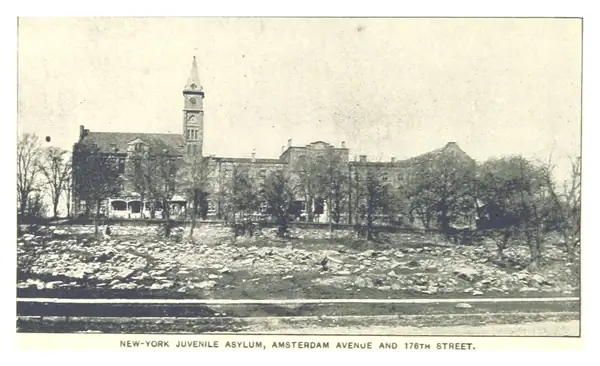
Incubator babies on show at fairs and resorts
10 dated shows 1896–1943 (Berlin 1896, London 1897, Omaha 1898, Buffalo 1901, Coney Island 1903, St. Louis 1904, Portland 1905 photo, Atlantic City 1905–43, Seattle 1909, Chicago 1933–34)
14 entries
- Incubator babies at Berlin, 1896Treptower Park
- Incubator babies at Queen Victoria's Jubilee, 1897Earls Court
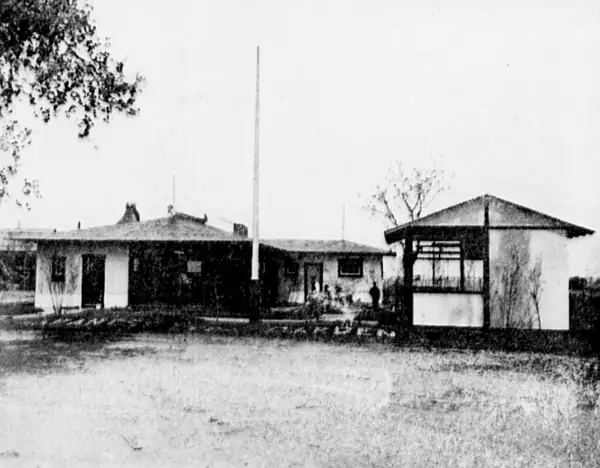 Incubator show at Omaha's Trans-Mississippi fair, 1898Kountze Park
- Infant incubators at the Pan-American Exposition, 1901Buffalo
- The Coney Island 'Infantorium'Coney Island
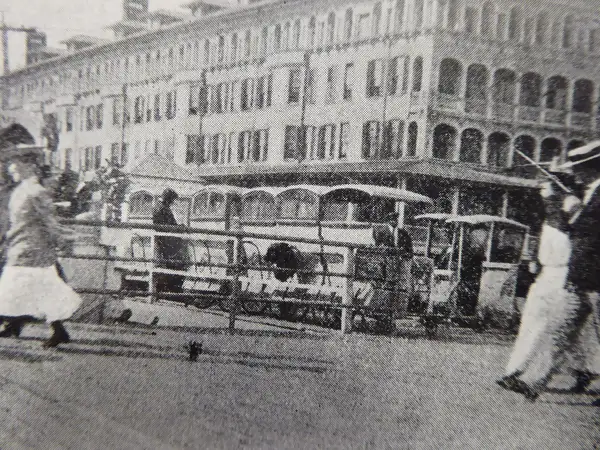 Atlantic City incubator exhibit, 1905–1943Atlantic City
- St. Louis, on the Pike / fair/stlouis-1904↗
- Portland: "Infant incubator building" photo
- Seattle A-Y-P / fair/seattle-1909↗
- Atlantic City incubator exhibit, 1905–1943Atlantic City
- Atlantic City incubator exhibit, 1905–1943Atlantic City
- Atlantic City incubator exhibit, 1905–1943Atlantic City
- Incubator babies at Chicago's Century of Progress, 1933Burnham Park (Chicago)
- Atlantic City incubator exhibit, 1905–1943Atlantic City
Immigration waves (refreshed)
8 depots, stations and schemes, active 1832–1954: Grosse Isle 1832–48, the 1836–1914 migration (over 30 million), Castle Garden 1855–90, Washington Avenue 1873–1915, Ellis Island 1892–1954, Ballinstadt 1901, Galveston Movement 1907–14, Angel Island 1910–40. The 1924 Immigration Act closes the window.
35 entries
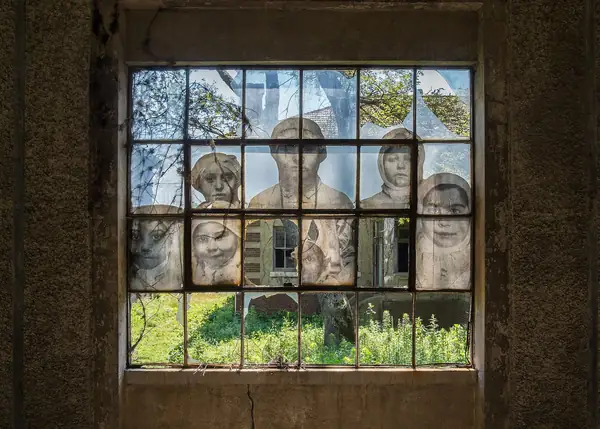 Immigration 1836–1914: over 30 millionBattery Park
- Grosse Isle quarantine stationGrosse Isle
- Immigration 1836–1914: over 30 millionBattery Park
- Grosse Isle quarantine stationGrosse Isle
- Castle Garden immigrant depotNew York City
- Immigration 1836–1914: over 30 millionBattery Park
- Castle Garden immigrant depotNew York City
- Immigration 1836–1914: over 30 millionBattery Park
- Castle Garden immigrant depotNew York City
- Immigration 1836–1914: over 30 millionBattery Park
- Washington Avenue Immigration Station, PhiladelphiaPennsport
- Castle Garden immigrant depotNew York City
- Immigration 1836–1914: over 30 millionBattery Park
- Washington Avenue Immigration Station, PhiladelphiaPennsport
- Castle Garden immigrant depotNew York City
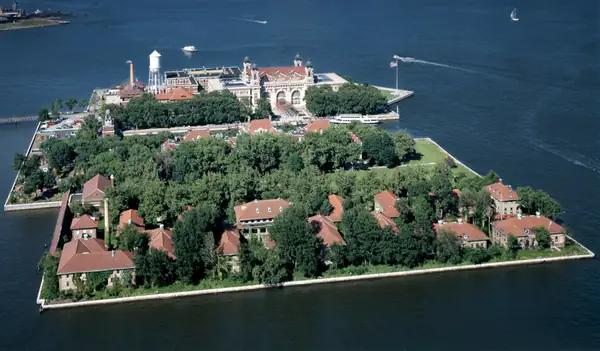 Ellis IslandNew York City
- Immigration 1836–1914: over 30 millionBattery Park
- Washington Avenue Immigration Station, PhiladelphiaPennsport
- Ellis IslandNew York City
- Immigration 1836–1914: over 30 millionBattery Park
- Washington Avenue Immigration Station, PhiladelphiaPennsport
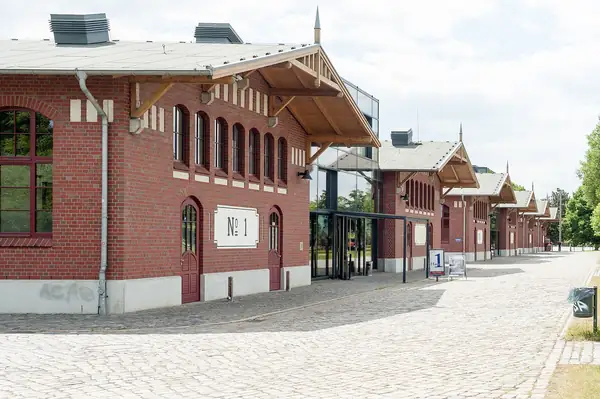 BallinStadt emigration halls, HamburgVeddel
- Galveston Movement, 1907–1914Galveston
- Ellis IslandNew York City
- Immigration 1836–1914: over 30 millionBattery Park
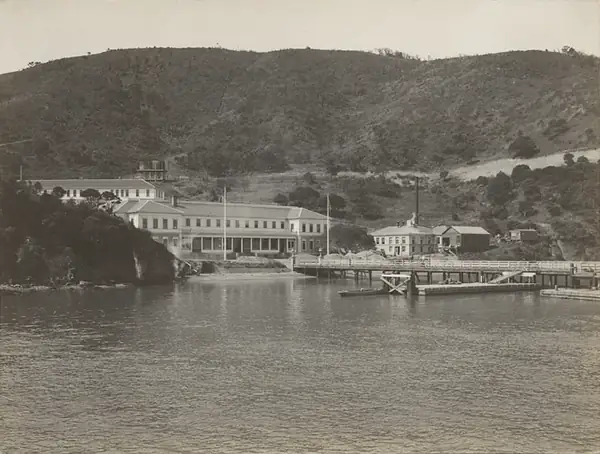 Angel Island Immigration StationAngel Island (California)
- Washington Avenue Immigration Station, PhiladelphiaPennsport
- Galveston Movement, 1907–1914Galveston
- Ellis IslandNew York City
- Angel Island Immigration StationAngel Island (California)
- Ellis IslandNew York City
- Angel Island Immigration StationAngel Island (California)
- Ellis IslandNew York City
- Angel Island Immigration StationAngel Island (California)
- Ellis IslandNew York City
What does NOT line up
6 problems
6 entries
- Order: the earliest raised ground in our data is now New York's African Burial Ground, raised 'with landfill in anticipation of development' in the late 1790s, a land-development raising. Apart from that, raisings start in the 1850s, alongside the repopulation signals, not before them.
- Asylums, orphanages and fires were already happening before any 19th-century raising: 38 asylum openings, 25 orphanage or child-institution records and 16 great fires before 1850 (fires 1700–1849).
- Dig-outs and rediscoveries are spread from 1709 to 2023 with no bunching (10 of 25 fall in 1850–1919, 7 before 1850), and the deepest burials on record are ancient with named causes (Pompeii and Herculaneum, AD 79 ash).
- The child-labour peak (15 in the 1900s, 16 in the 1910s) mostly reflects when Lewis Hine was photographing for the NCLC, not necessarily when child labour peaked.
- Incubator shows start in 1896, 40 years after the orphan trains, and run into the 1940s; they follow the fairs and one showman (Martin Couney), not a population gap.
- Immigration is the largest flow on record (over 30 million, 1836–1914) and starts in the 1830s, before the raisings, so arrivals don't wait for the mud-flood evidence either.
Open questions
- Is there dated deposit evidence (raised streets, buried storeys) from before 1850 in the same cities that later got orphan trains and asylums?
- Do the children's origins in placement records point to the cities with buried floors?
- Why do asylum openings jump from 14 in the 1840s to 29 in the 1860s in both Britain and the US?
What would support it
- Buried storeys or raised streets dated to the 1800s–1840s in eastern US and British cities, before the 1850s jump.
- Placement and admission records with no traceable birthplaces, clustered after a dateable event.
- A population dip (in census or parish records) just before the 1850s, followed by the institutional boom.
What would rule it out
- Raisings that are each tied to a dated local cause (Chicago drainage, Sacramento's 1861–62 floods, Seattle's 1889 fire, Galveston's 1900 storm), which our records already show.
- Institution openings that track ordinary drivers (state laws, Dorothea Dix's campaign, industrial cities growing) decade by decade.
- Orphanages and asylums steadily increasing from the 1700s rather than starting after a break; the final pre-1850 counts (38 asylums, 25 child institutions) lean this way.
Selection bias
High: the asylum list is UK- and US-heavy (80 and 70 of 187), child-labour rows are mostly one photographer, and the fire list was searched hardest for 1835–1922.
The rating counts how much of our gathered material lines up with the pattern. It is not a probability that the hypothesis is true, and every count is limited by which buildings were picked for the app (see 'selectionBias' on each card).
Next hypothesis
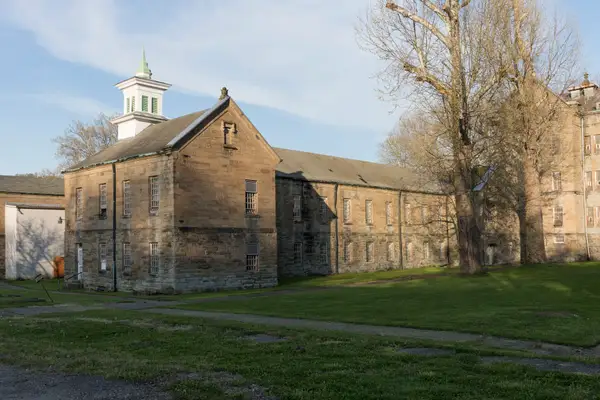 Moderate31 entries#9Too big for the townSet the recorded census next to the building and the mismatch is plain: asylums designed for a third of the town's whole population, a 37-year capitol begun in a prairie town of under 6,000, domed capitols in state capitals of 6,000 to 12,000 people. Common sense says a town of a few thousand doesn't have the money, the stone, the masons or the reason for a palace. One possibility is that some of these buildings were already standing and the town grew around them, or that they were paid for and supplied from far outside the town.