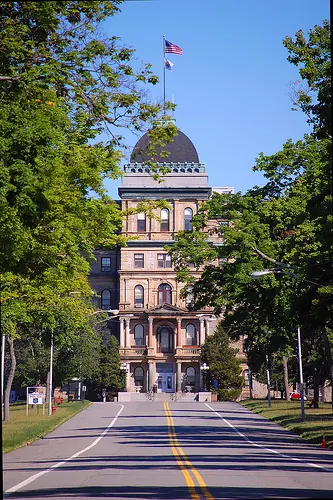
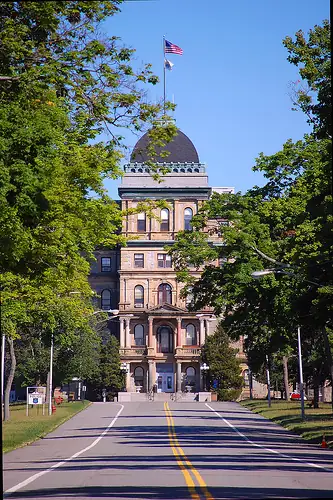
 #1Morris Plains, New JerseyGreystone ParkAlmost 2,000 square feet per patient. Who was it really built for?673,700 sq ft built for 350 patients; it later held more than 7,700.
Research
Does It Add Up?
Also called “Too Big for the Town”
Buildings set against the towns, workforces and timelines the record gives them, scored from sourced facts only.
The hypothesis
Where were the skilled hands? Emerging
Where the record does name the workforce, it keeps saying the same thing: the skills had to be imported (Scottish granite cutters, German and Irish masons) or forced (convicts). Yet the same decades are credited with thousands of carved stone buildings across small towns. Common sense: if Texas had to send to Scotland for 86 stonecutters, who was cutting stone for every county courthouse and capitol at the same time? One possibility is that far fewer buildings were cut new than the record implies, and many crews were finishing, repairing or refacing existing stonework.
- State counts are now in. What were the town and county counts of masons, stonecutters and carvers in the build years (IPUMS full-count data)?
- Where were the training yards for the carvers of 250 City Hall sculptures?
Hidden history
What the record shows
Some buildings are far bigger, finer or faster than the record says the place could manage at the time: a hospital for hundreds with room for thousands, a capitol in a frontier town, a downtown rebuilt in stone within months of a fire. Each entry here is scored from facts in the linked sources, factor by factor, so you can see exactly where the numbers stop adding up.
Seven factors
Population vs size, masons, artisans, materials and transport, build time, gaps in the records, and physical clues. Each factor scores 0 to 10 from sourced inputs only.
Out of 100
The score is ten times the average of the factors that have sourced inputs. Factors with nothing on record are left out, never guessed.
From N factors
The factor count shows how much the score rests on. One factor is a hint; five is a pattern.
Questions worth asking
- Who was each building really sized for?
- Where did the skilled hands come from, and where are their names?
- Why are the records thinnest exactly where the work was biggest?
Ranked by score 52
Highest score first. Tap a gauge to see every factor and the sourced facts behind each point; the factor count shows how much each score rests on.
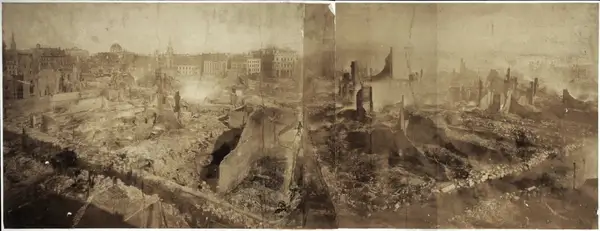
#1Morris Plains, New JerseyGreystone ParkAlmost 2,000 square feet per patient. Who was it really built for?673,700 sq ft built for 350 patients; it later held more than 7,700.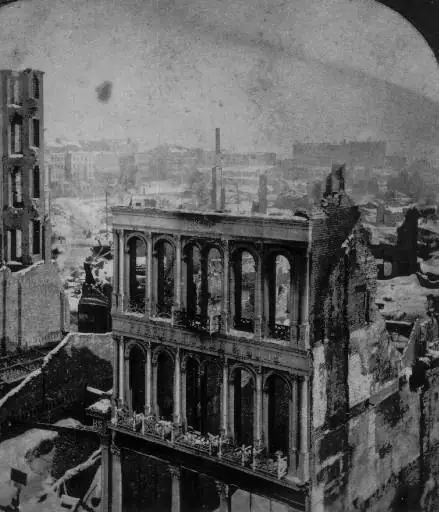 #2BostonBoston financial district rebuildHundreds of buildings back in two years. Where did the masons come from?776 buildings on 65 acres burned in November 1872; the financial district was rebuilt in under two years.
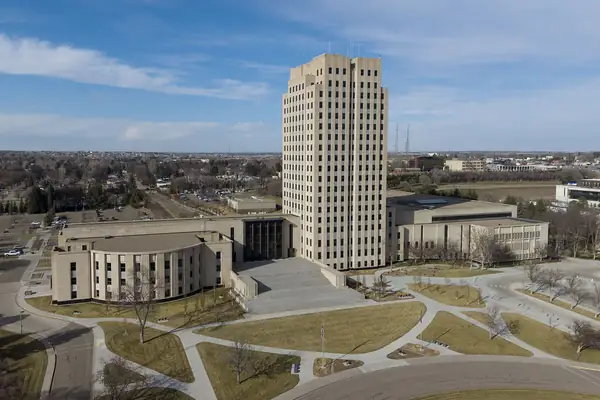 #3Bismarck · 1934North Dakota State CapitolAbout 11,090 people in 1930, and a building costing $2 million. Who in a town that size was paying for this, and who was building it?The tower and wing were built between 1931 and 1934, at a cost of $2 million.
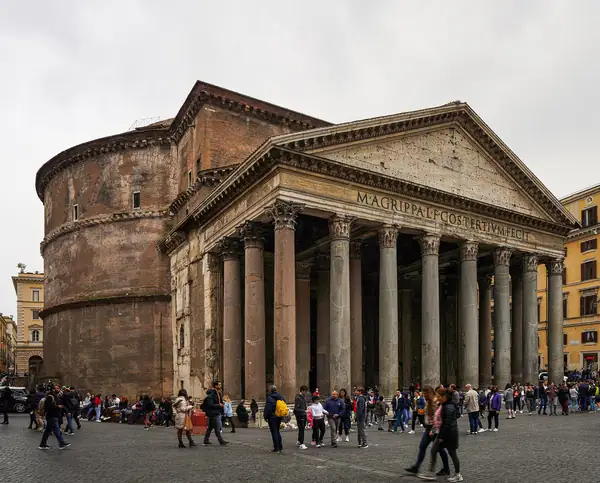 #4Rome, ItalyPantheonHow does a metre-plus of ground build up around one building?The portico once stood seven steps (1.3 m) above the forecourt; flooding raised the ground, and until the 17th century visitors walked down to it.
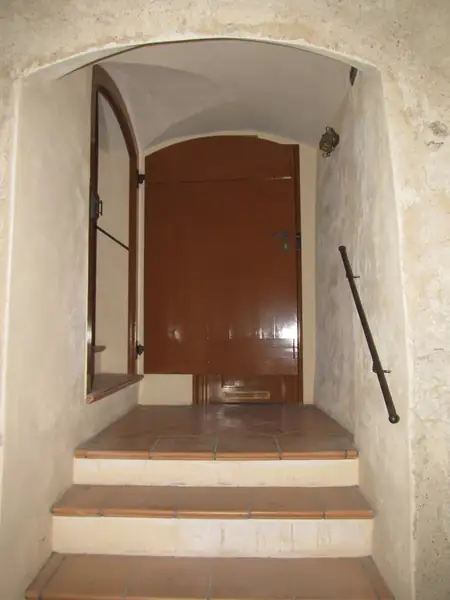 #5Prague, Czech RepublicRomanesque palace, PragueThe cellar was the main floor. How many 'cellars' are buried floors?The old ground floor and part of the first floor of a Romanesque palace now form the basement and ground floor.
 #6AtlantaUnderground AtlantaThe shopfronts are still down there. Why keep them?In 1928 viaducts raised four streets by a storey and a half; the old ground-floor shopfronts became basements.
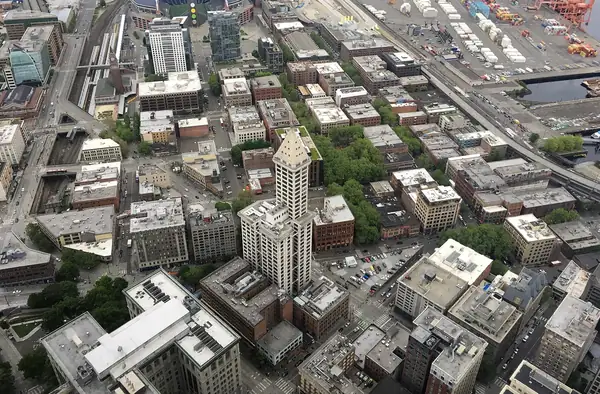 #7SeattleSeattle's Pioneer SquareDozens of stone buildings in 18 months, on top of the old street. How?Nearly all wood burned in June 1889; by the end of 1890 dozens of brick and stone buildings stood, with streets raised a storey over the old shopfronts.
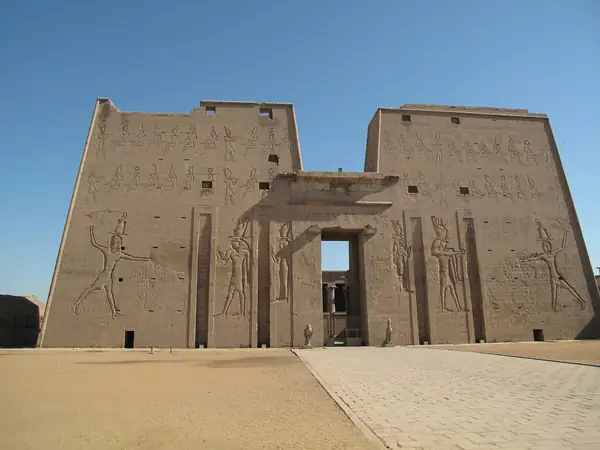 #8Edfu, EgyptTemple of EdfuTwelve metres of fill. Over how long, really?Buried 12 m deep in sand and silt; Mariette began clearing it in 1860.
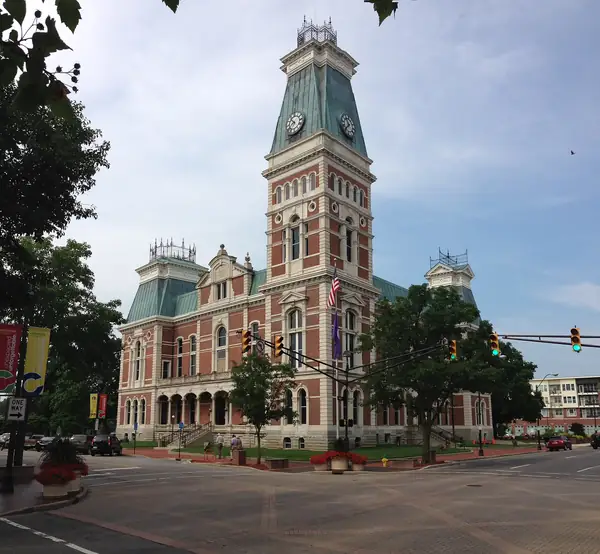 #9Columbus · 1874Bartholomew County CourthouseAbout 3,359 people in 1870, and a building costing $250,000. Who in a town that size was paying for this, and who was building it?It was designed by noted Indiana architect Isaac Hodgson, built in 1871–1874 at the cost of $250,000, and dedicated in 1874.
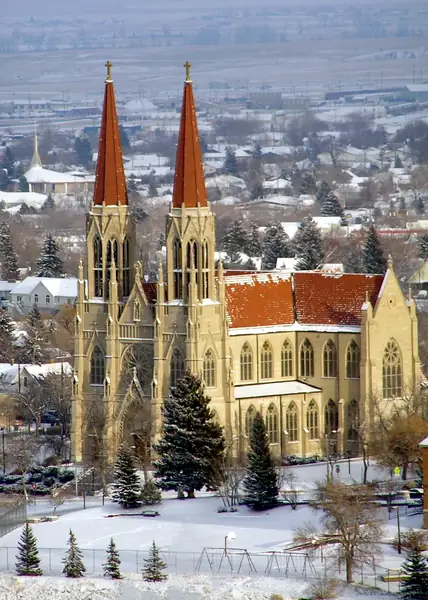 #10Helena · 1914Cathedral of Saint HelenaAbout 12,515 people in 1910, and a building costing $645,000.. Who in a town that size was paying for this, and who was building it?Construction began on the cathedral in 1908, and it held its first mass in November 1914. Its total cost of construction amounted to $645,000.
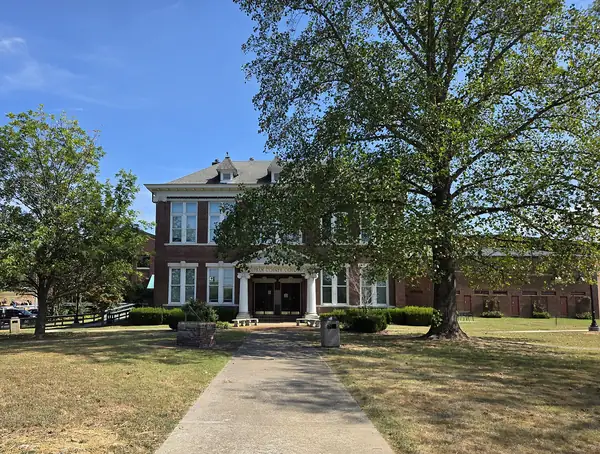 #11Ashland City · 1869Cheatham County Courthouse$12,000 in a town of about 121. That is roughly $99 for every man, woman and child. Does that add up?The original courthouse was completed in 1869 for a cost of $12,000.
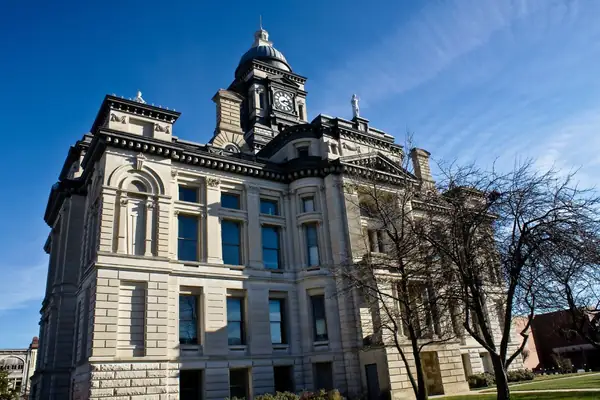 #12Frankfort · 1882Clinton County Courthouse (Indiana)About 2,803 people in 1880, and a building costing $170,450. Who in a town that size was paying for this, and who was building it?The courthouse cost $170,450 to build in 1882.
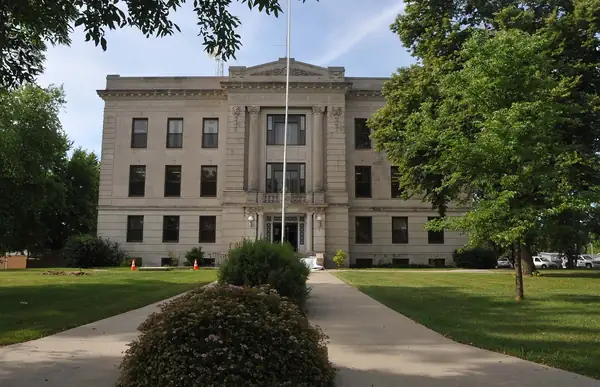 #13Clear Lake · 1916Deuel County Courthouse and JailAbout 835 people in 1920, and a building costing $75,000. Who in a town that size was paying for this, and who was building it?It is a three-story three-bay building built of Bedford limestone and cost $75,000 when built in 1916.
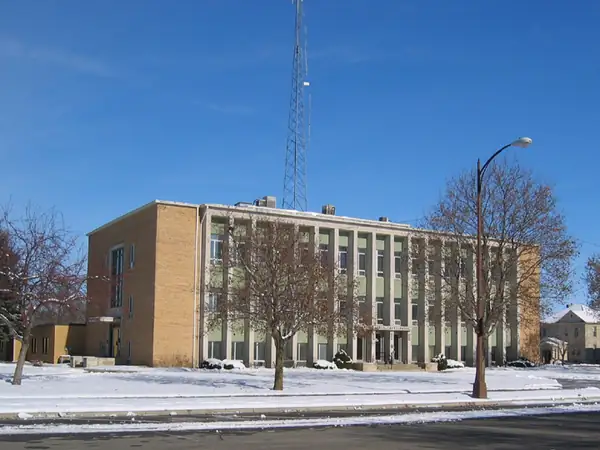 #14Estherville · 1884Emmet County Courthouse (Iowa)A town of 138 (1880 census) and a $11,718 building. Where did the money, the stone and the skilled hands come from?In 1884 a two-story, brick, Italiante courthouse was built for $11,718.
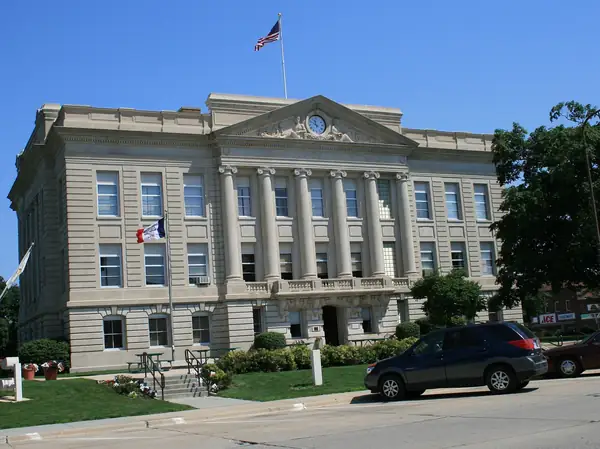 #15Jefferson · 1917Greene County Courthouse (Iowa)$200,000 in a town of about 3,416. That is roughly $59 for every man, woman and child. Does that add up?The present courthouse was dedicated in 1917 and was built at a cost of $200,000.
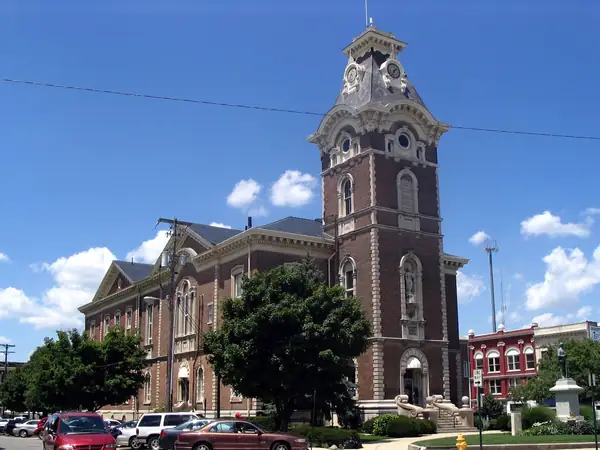 #16New Castle · 1869Henry County Courthouse (Indiana)$120,000 in a town of about 1,556. That is roughly $77 for every man, woman and child. Does that add up?The Court House was built between 1865 and 1869 at a cost of $120,000.
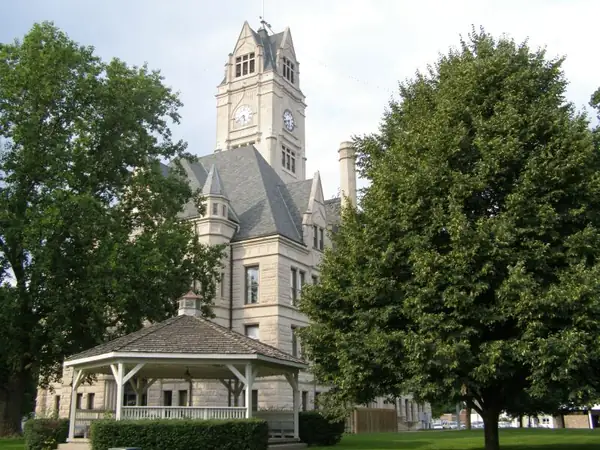 #17Rensselaer · 1898Jasper County Courthouse (Indiana)A town of 2,255 (1900 census) and a $141,732 building. Where did the money, the stone and the skilled hands come from?The Jasper County Courthouse was erected in 1898 at a total cost of $141,731.94.
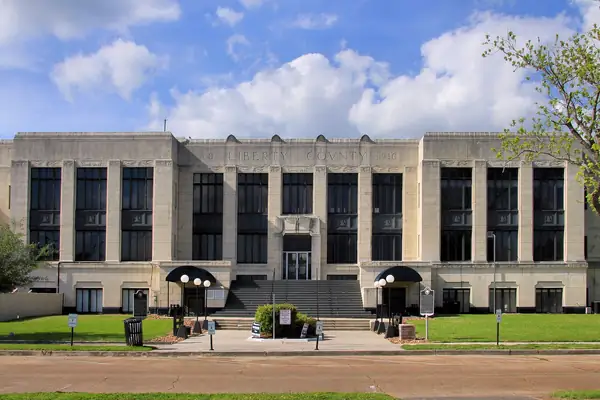 #18Liberty · 1931Liberty County Courthouse (Texas)About 2,187 people in 1930, and a building costing $250,000. Who in a town that size was paying for this, and who was building it?Construction took up most of 1931 and was finally completed in December at a grand total of $250,000.
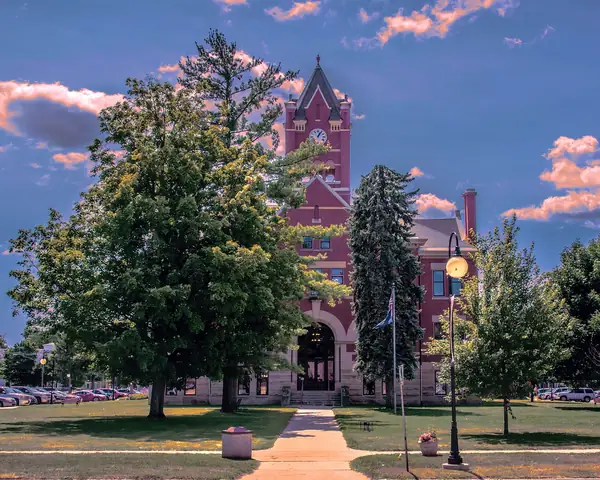 #19Centreville · 1900St. Joseph County Courthouse (Michigan)$34,419 in a town of about 645. That is roughly $53 for every man, woman and child. Does that add up?The construction of the courthouse was completed by August 1900, at a total cost of $34,418.90.
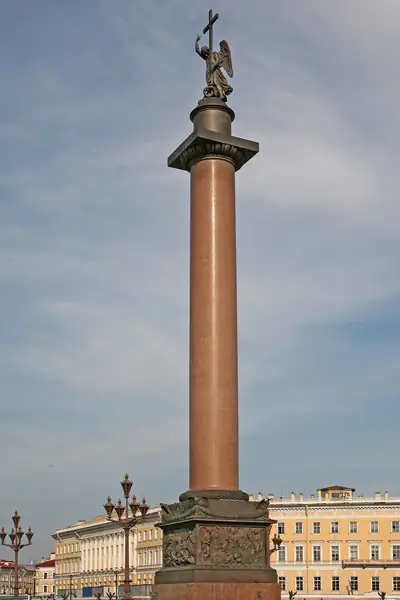 #20Saint Petersburg, RussiaAlexander ColumnSix hundred tonnes stood upright in under two hours, in 1832. How?A 600-tonne granite monolith from Virolahti, Finland, brought by sea in 1832 on a specially built barge and erected on 30 August 1832 by 3,000 men in under two hours.
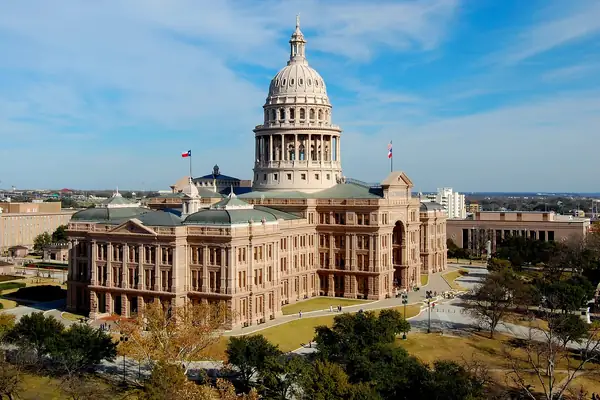 #21AustinTexas State CapitolThey had to bring stonecutters from Scotland and use convicts. If the skills weren't here, how were so many stone buildings going up across the country?Built 1882–88 of donated Granite Mountain red granite, by up to a thousand convicts and migrant workers at a time, including 86 granite cutters from Scotland. The builders were paid with over three million acres of land.
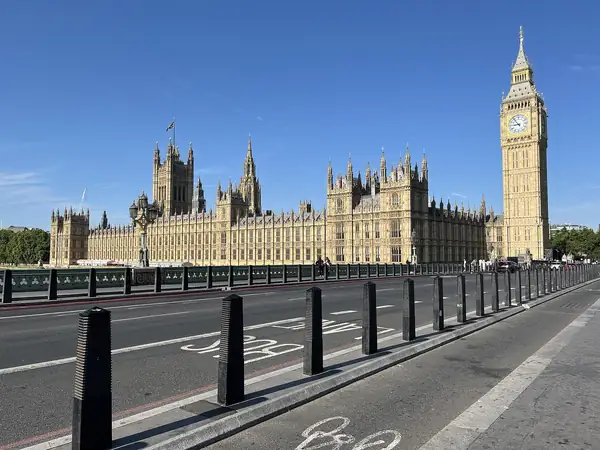 #22London, EnglandPalace of WestminsterIf the Gothic expert couldn't put his own name on his designs, whose names are on the others?Barry's 1836 competition win was drawn with Pugin's help; Barry was inexperienced with Gothic and relied on Pugin, who had to submit designs in other architects' names.
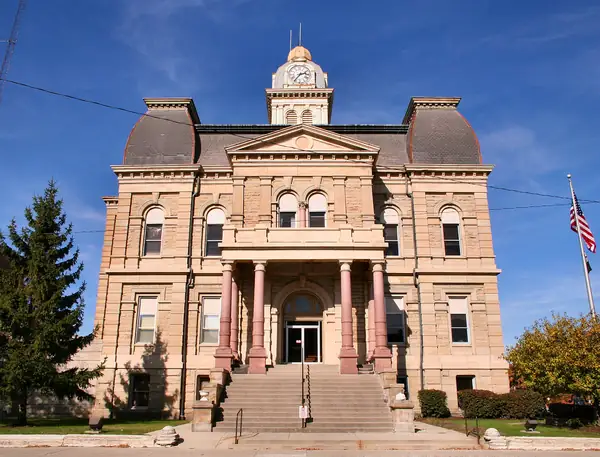 #23Lima · 1884Allen County Courthouse (Ohio)About 7,567 people in 1880, and a building costing $360,000. Who in a town that size was paying for this, and who was building it?It was built between 1881 and 1884 at a cost of $360,000 by architect George H. Maetzel.
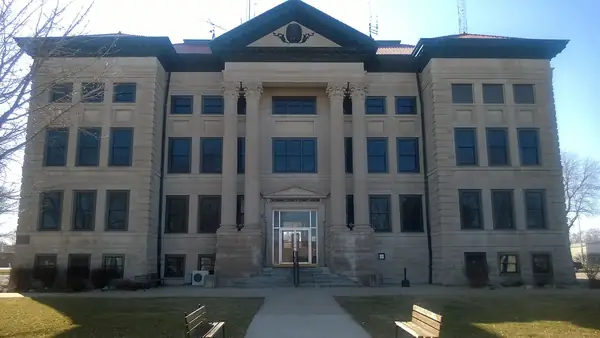 #24Rockwell City · 1877Calhoun County Courthouse (Iowa)$2,000 in a town of about 90. That is roughly $22 for every man, woman and child. Does that add up?The county seat moved to Rockwell City in 1877 and a new courthouse built for just over $2,000.
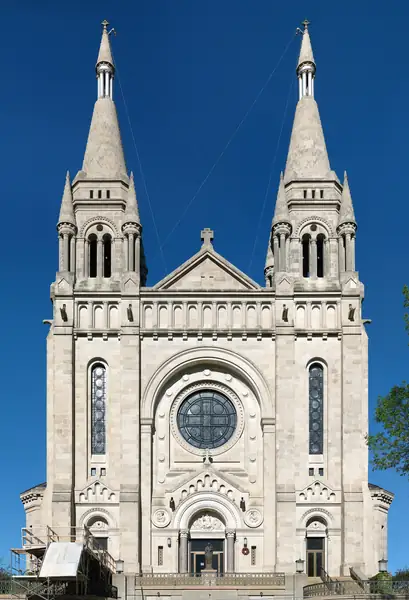 #25Sioux Falls · 1915Cathedral of Saint Joseph (Sioux Falls, South Dakota)About 14,094 people in 1910, and a building costing $390,000.. Who in a town that size was paying for this, and who was building it?Construction of the new cathedral began in 1915. The final cost was $390,000.
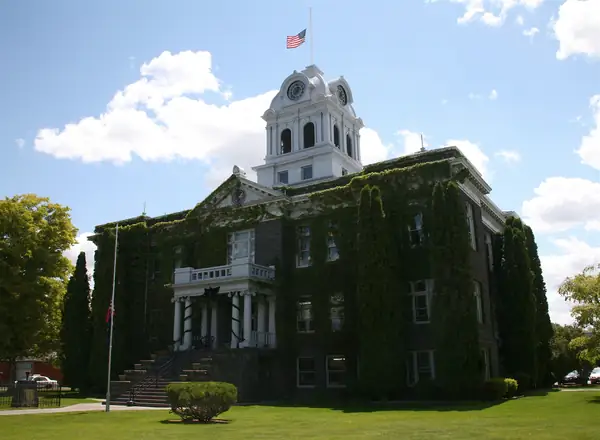 #26Prineville · 1907Crook County CourthouseAbout 1,042 people in 1910, and a building costing $50,000. Who in a town that size was paying for this, and who was building it?The new Crook County Courthouse was completed in May 1909. In January 1907, the Crook County Commission let out a contract for construction of a new courthouse at a cost of $50,000.
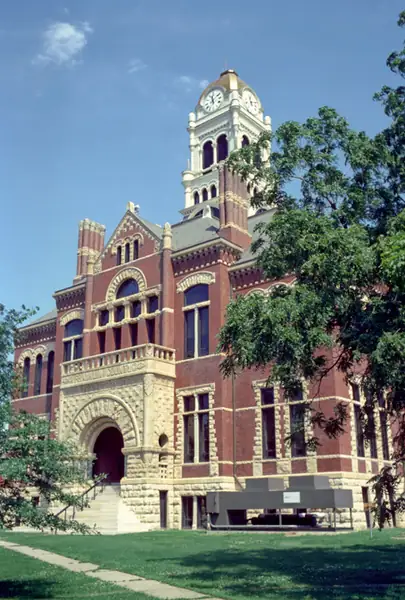 #27Hampton · 1891Franklin County Courthouse (Iowa)$60,000 in a town of about 2,067. That is roughly $29 for every man, woman and child. Does that add up?The present Romanesque Revival building, by Minneapolis architect T.D. Allen, was completed in 1891 at a cost of $60,000.
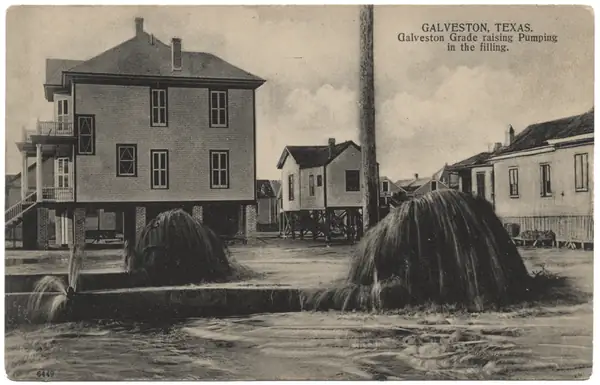 #28GalvestonGalveston grade raisingWhole city blocks lifted and filled in under a decade. With what equipment?Over 2,100 buildings, including a 3,000-ton church, were raised and about 500 blocks filled by 1911, some by 17 ft.
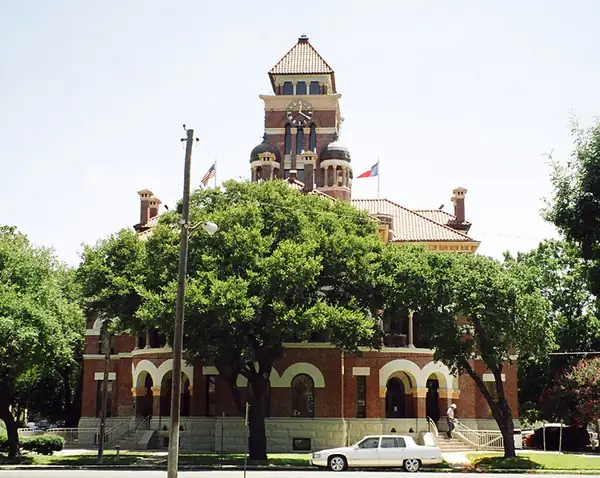 #29Gonzales · 1898Gonzales County CourthouseAbout 4,297 people in 1900, and a building costing $64,450.. Who in a town that size was paying for this, and who was building it?The contract was let on June 26, 1894, and the courthouse was completed on April 8, 1898. The structure cost $64,450.
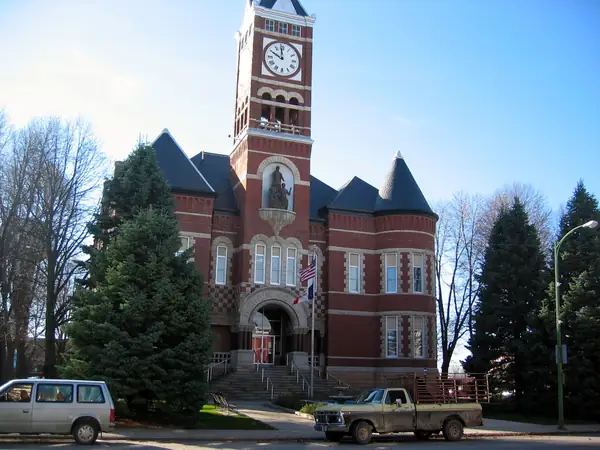 #30Eldora · 1892Hardin County Courthouse (Iowa)$48,000 in a town of about 1,577. That is roughly $30 for every man, woman and child. Does that add up?The current courthouse opened in 1892 at a cost of $48,000.
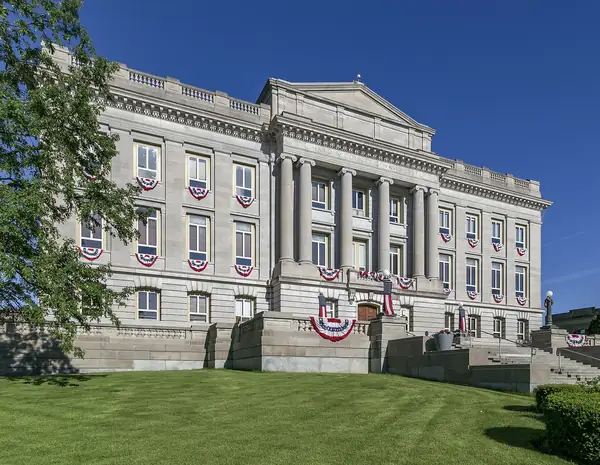 #31Kenton · 1915Hardin County Courthouse (Ohio)$275,000 in a town of about 7,185. That is roughly $38 for every man, woman and child. Does that add up?Located in Kenton, Ohio, United States, it was completed in 1915 at a cost of $275,000.
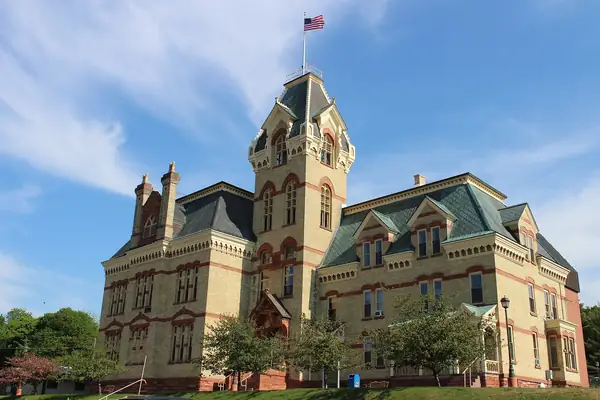 #32Houghton · 1887Houghton County Courthouse$75,568 in a town of about 2,062. That is roughly $37 for every man, woman and child. Does that add up?The cornerstone, with a miner's coat of arms, was laid on July 24, 1886, and the new courthouse was dedicated on July 28, 1887. The county hired Marquette architect J. B. Sweatt to design the courthouse, which was built on the site of the older courthouse at a cost of $75,568.00.
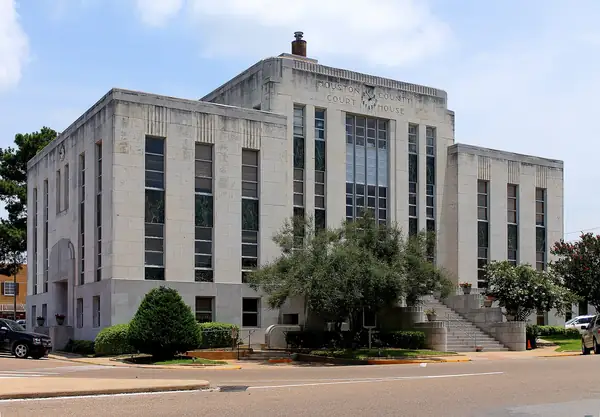 #33Crockett · 1940Houston County Courthouse (Texas)About 4,536 people in 1940, and a building costing $180,000. Who in a town that size was paying for this, and who was building it?The building was accepted by the Houston County Commissioners in late 1939 and early 1940 and opened shortly thereafter. The cost of the new courthouse exceeded $180,000.
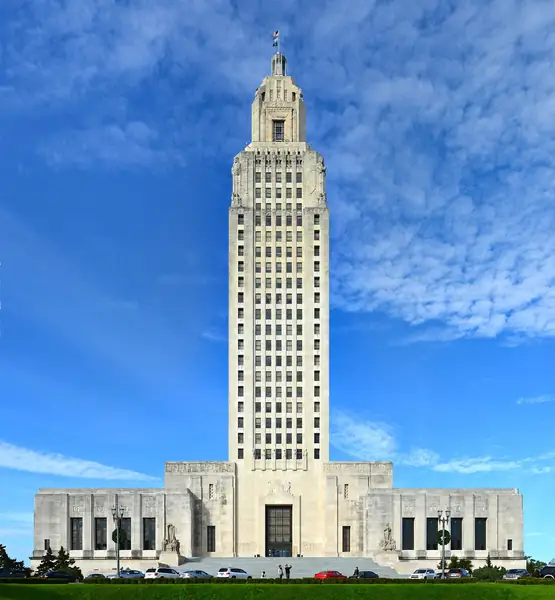 #34Baton Rouge · 1931Louisiana State CapitolA 1931 skyscraper capitol faced with Alabama limestone. How was that much stone moved and carved in so short a time?The building's construction was completed in 1931. The Capitol's facade was constructed out of limestone from Alabama.
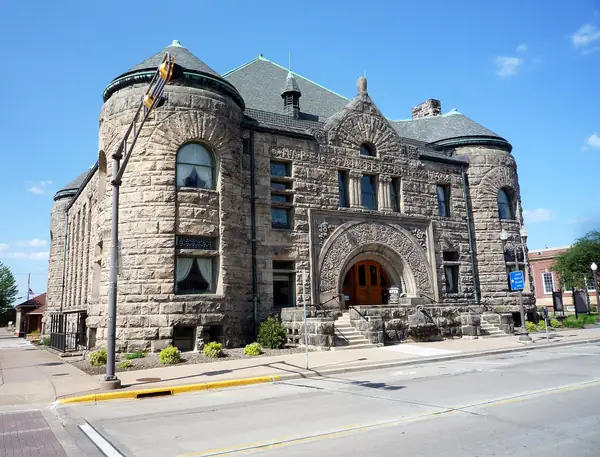 #35Menomonie · 1889Mabel Tainter Memorial BuildingAbout 5,491 people in 1890, and a building costing $125,000,. Who in a town that size was paying for this, and who was building it?The building was constructed in 1889 and cost approximately $125,000.
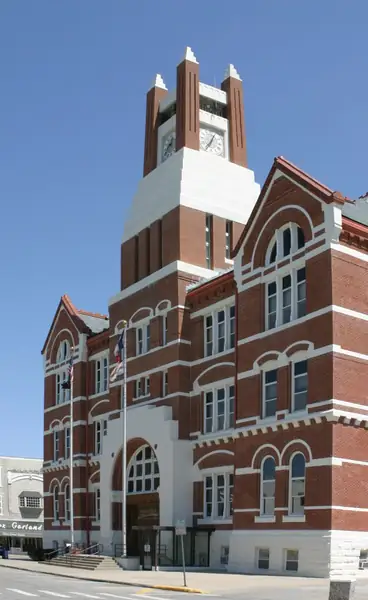 #36Oskaloosa · 1886Mahaska County CourthouseAbout 6,558 people in 1890, and a building costing $132,000. Who in a town that size was paying for this, and who was building it?It was built for $132,000 and was dedicated in 1886.
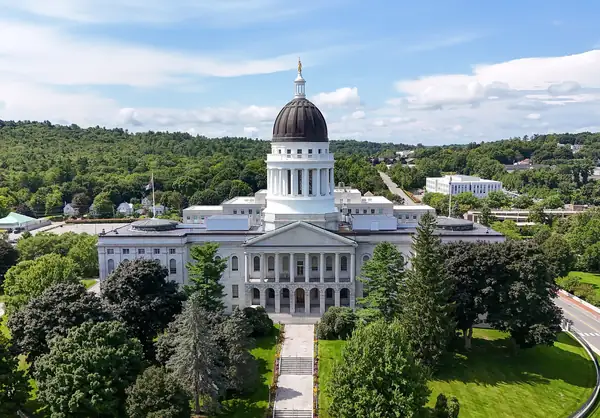 #37Augusta · 1832Maine State HouseAbout 3,980 people in 1830, and a building costing $80,000,. Who in a town that size was paying for this, and who was building it?The building was completed in 1832, one year after Augusta became the capital of Maine. The cost of the building was originally estimated to be $80,000, but when completed, expenditures of the building, furnishings and grounds amounted to $135,000, of which $11,500 was contributed by the city of Augusta. Construction was of granite from Hallowell quarries and took three years to complete.
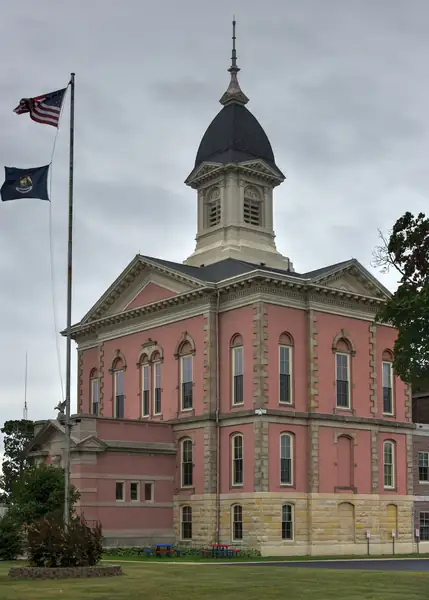 #38Menominee · 1875Menominee County CourthouseAbout 1,597 people in 1870, and a building costing $29,680. Who in a town that size was paying for this, and who was building it?The building was completed in 1875 at a cost of $29,680.
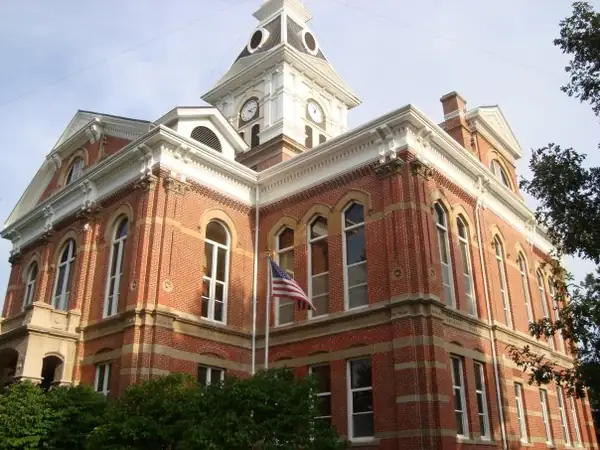 #39Clarinda · 1887Page County Courthouse (Iowa)A town of 3,262 (1890 census) and a $86,500 building. Where did the money, the stone and the skilled hands come from?Planning for the current courthouse was begun in 1882 and the foundations were laid in 1885 and the building, completed in 1887, cost $86,500 to construct.
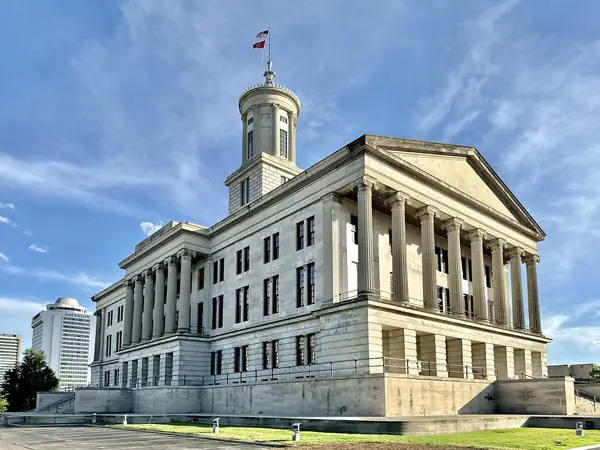 #40Nashville · 1859Tennessee State CapitolBuilt by artisans, convicts and enslaved people. Whose names are on the record, and whose are missing?The statehouse was built between 1845 and 1859 by skilled artisans and convict and slave labor. It was constructed predominantly of limestone quarried nearby, and was one of the first buildings in the United States to use iron as a structural element.
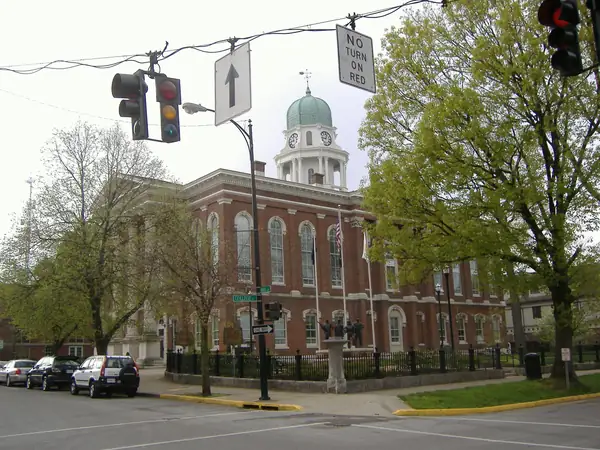 #41Bowling Green · 1868Warren County Courthouse (Kentucky)A town of 4,574 (1870 census) and a $125,000 building. Where did the money, the stone and the skilled hands come from?An 1874 description rightly stated that the city had, 'next to that at Louisville, the most elegant courthouse in Kentucky, built in 1868-69, at a cost of $125,000.'
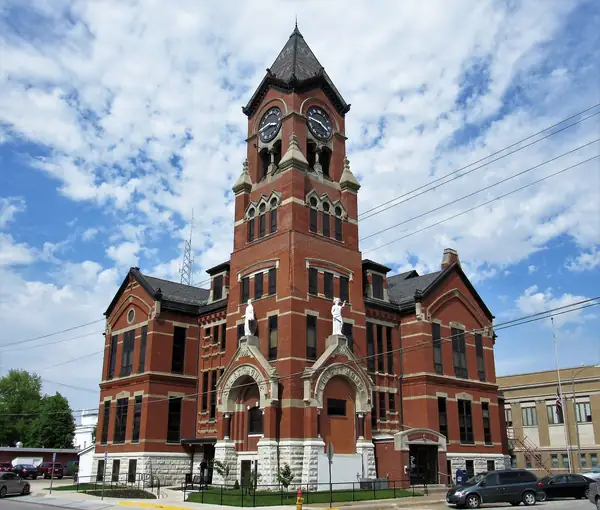 #42Washington · 1887Washington County Courthouse (Iowa)A town of 3,235 (1890 census) and a $75,000 building. Where did the money, the stone and the skilled hands come from?The present courthouse was built for $75,000 in 1887.
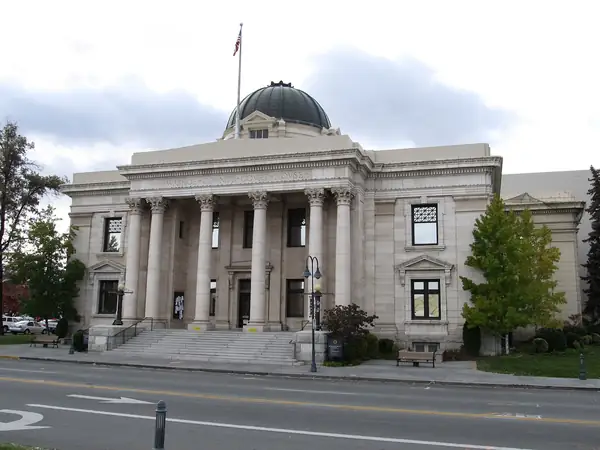 #43Reno · 1910Washoe County CourthouseA town of 10,867 (1910 census) and a $250,000 building. Where did the money, the stone and the skilled hands come from?The building is a replacement for a previous courthouse on the site, and was built for $250,000 during 1910–11.
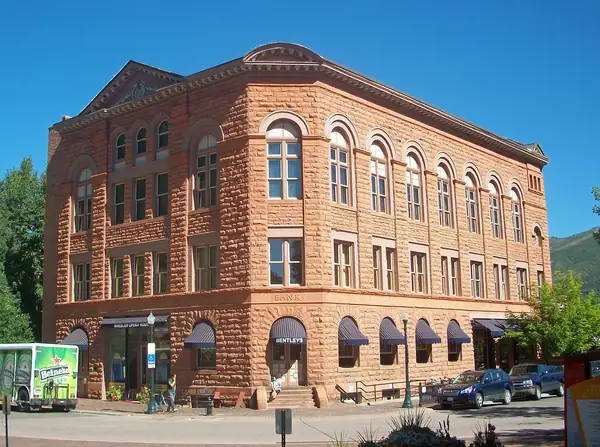 #44Aspen · 1889Wheeler Opera HouseAbout 5,108 people in 1890, and a building costing $100,000. Who in a town that size was paying for this, and who was building it?It was built in ten months from June 1888 to April 1889 at a cost of $100,000.
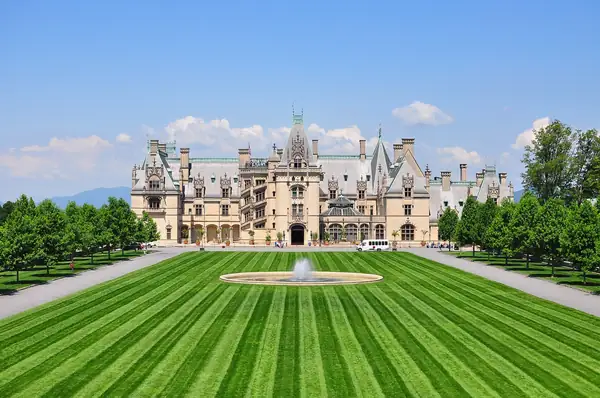 #45Asheville, North CarolinaBiltmore HouseSixty stonemasons for the largest house in America in six years. Does that add up?178,926 sq ft of Indiana limestone built 1889–95 by about 1,000 workers and 60 stonemasons; a 3-mile rail spur, a brick kiln and a woodworking factory were built on site.
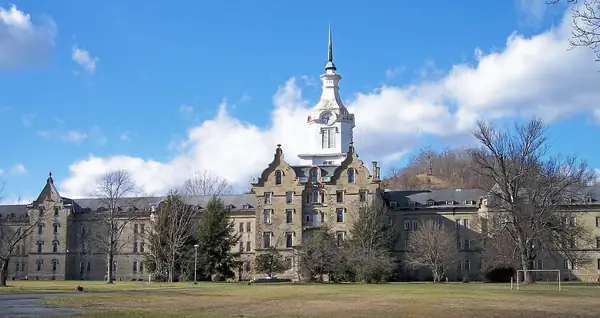 #46Weston, West VirginiaTrans-Allegheny Lunatic AsylumHand-cut stone on this scale, in a rural county. Where did the masons come from?One of the largest hand-cut stone buildings in the US, designed for 250.
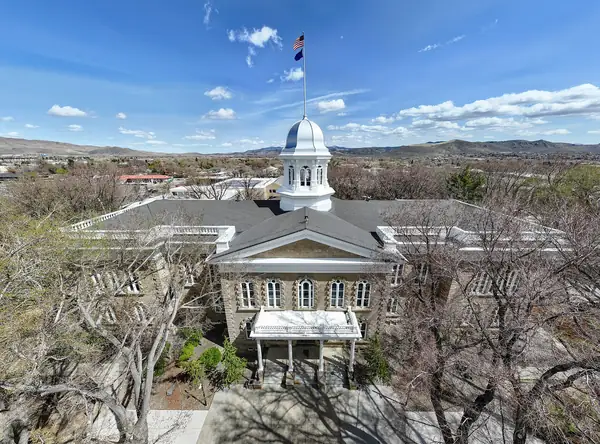 #47Carson City · 1871Nevada State CapitolAbout 3,042 people in 1870, and a building costing $84,000. Who in a town that size was paying for this, and who was building it?The building was constructed in the Neoclassical Italianate style between 1869 and 1871. The Board of Capitol Commissioners received bids of $84,000 to $160,000 for construction and they chose the lowest bid, submitted by Peter Cavanaugh and Son of Carson City. To reduce costs, the building sandstone was obtained free of charge from the Nevada State Prison quarry, just outside Carson City.
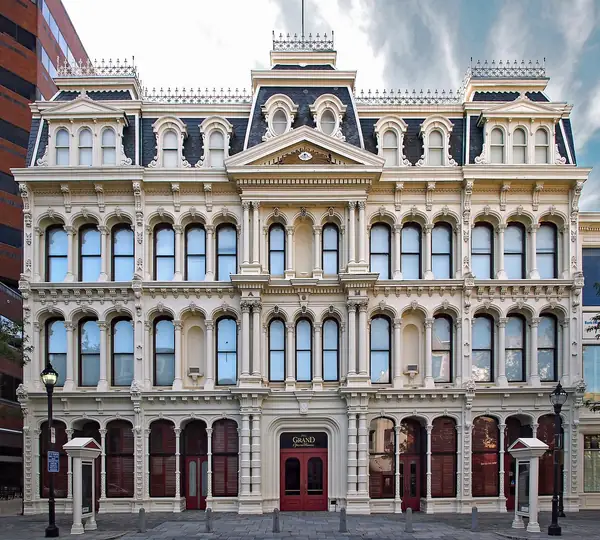 #48Wilmington · 1871Grand Opera House (Wilmington, Delaware)About 30,841 people in 1870, and a building costing $100,000.. Who in a town that size was paying for this, and who was building it?The four-story building was built in 1871 by the Delaware Grand Lodge of Masons to serve as a Masonic Temple and auditorium. The construction cost was $100,000.
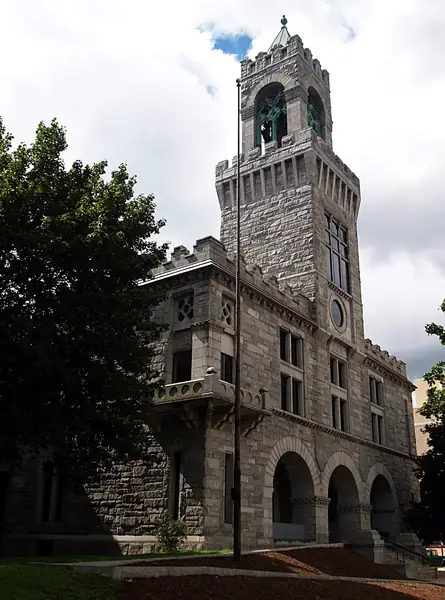 #49Springfield · 1874Hampden County CourthouseAbout 26,703 people in 1870, and a building costing $214,068. Who in a town that size was paying for this, and who was building it?Construction began in late 1871, and the building was dedicated on April 28, 1874. The original building cost $214,068.
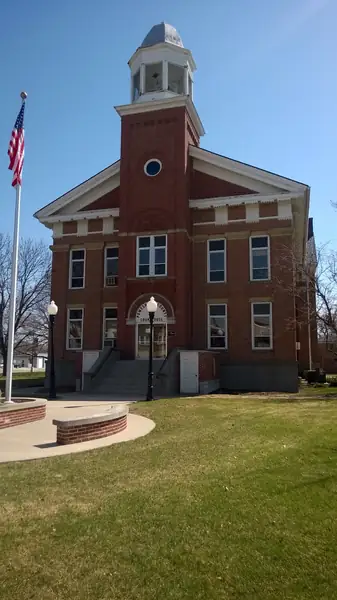 #50Montezuma · 1856Poweshiek County CourthouseA town of 564 (1860 census) and a $1,928 building. Where did the money, the stone and the skilled hands come from?The present building was built for $1,928.15 in 1856.
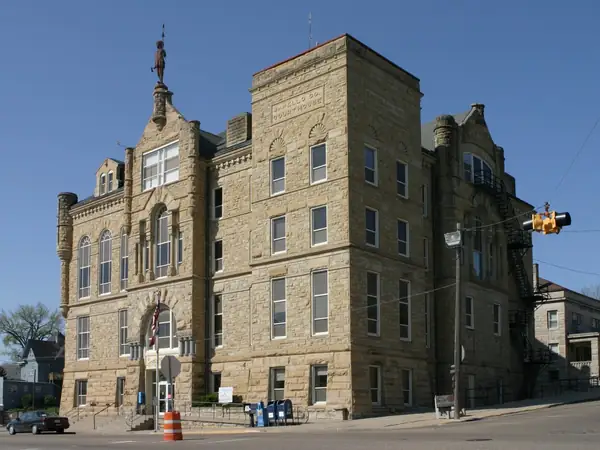 #51Ottumwa · 1894Wapello County CourthouseAbout 14,001 people in 1890, and a building costing $135,000. Who in a town that size was paying for this, and who was building it?The present courthouse was built for $135,000 and dedicated in 1894.
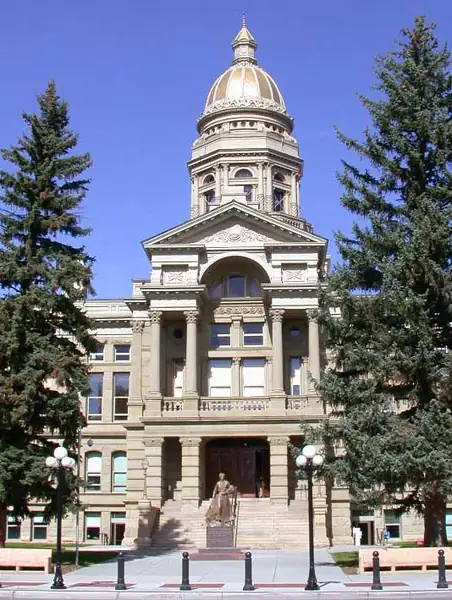 #52Cheyenne · 1890Wyoming State CapitolSandstone hauled about 214 km from Rawlins in the 1880s. How was it cut, moved and set so fast?Built between 1886 and 1890, the capitol is located in Cheyenne. The sandstone for the building came from quarries in Rawlins, Wyoming, and Fort Collins, Colorado.
How this score works
A transparent count of the gaps between what the record says was built and what the record says was available to build it. It is not a probability and not a verdict. Every point comes from a sourced input listed under the factor; a factor with no sourced inputs is left null and does not count.
Each factor scores 0 to 10 (0 = the record adds up, 10 = a large, documented gap).
overall = round(10 × average of the non-null factor scores), 0–100.
confidence = number of non-null factors that went into the score (1–7). A score from one factor is a hint; a score from five is a pattern.
- Population vs size
- Floor area per intended occupant (sq ft ÷ design capacity): under 300 = 1; 300–700 = 3; 700–1,500 = 6; over 1,500 = 8. Or, if the record gives opening occupants and design capacity: capacity ÷ opening occupants under 2 = 1; 2–5 = 4; 5–10 = 6; over 10 = 8. Add 2 (max 10) if the building's capacity is over 10% of the town's recorded population at the time. Also, only when the record gives the numbers: (a) Asylums: peak or design patients ÷ the host town's census population nearest the opening year: under 5% = 1; 5–15% = 3; 15–30% = 5; 30–60% = 7; over 60% = 9. (b) Civic buildings (capitols, courthouses, cathedrals, opera houses): recorded construction cost ÷ the town's census population nearest completion = dollars per resident (not adjusted for inflation): under $10 = 1; $10–50 = 3; $50–150 = 5; $150–500 = 7; over $500 = 9. Planned, estimated or 'expected' costs are not used.
- Masons needed vs available
- +4 if masons or stonecutters are recorded as brought in from another country; +3 if convict or forced labour is recorded; floor area per recorded mason: 1,500–3,000 sq ft = +3, over 3,000 = +5. Max 10. 0 if the record shows an adequate local workforce.
- Artisans needed vs available
- +4 if carvers/sculptors/designers are recorded as imported; +3 if fine detail is recorded but no carvers are named; +3 if the detail designer is recorded as working under someone else's name. Max 10.
- Materials and transport
- +2 if a rail spur or special vessel had to be built to bring stone in; +3 if a single block over 100 tonnes was moved; +3 if stone came from over 300 km away; +2 if over 1,000 tonnes of material per year of build is implied. Max 10. 0 if local stone and existing rail are recorded. Quarry distance is a straight line between the building's and the named quarry town's coordinates, and both sources are listed.
- Build time vs scale
- Floor area per build year: under 10,000 sq ft = 1; 10,000–30,000 = 3; 30,000–60,000 = 5; 60,000–120,000 = 7; over 120,000 = 9. For a district rebuild: masonry buildings finished within two years of a fire: under 10 = 2; 10–30 = 5; over 30 = 7. For a single heavy lift: +4 if a monolith over 500 t was raised in under a day.
- Gaps in the records
- +3 builder or contractor not recorded; +3 credited architect disputed or designs filed under another name; +2 plans or drawings recorded as lost; +2 payroll or cost not recorded, or records recorded as destroyed by fire. Max 10.
- Physical clues
- +4 windows, doors or a floor now below grade are documented; +3 ground level around it documented as raised 1 m or more; +3 documented as buried and dug out. Max 10.
What the census says
Counts of carpenters, masons, stonecutters, plasterers and iron workers, read from the printed US Census occupation tables. State counts cover the whole state, not the town.
Where it cuts against the hypothesis
- Strong by count (31) once the extra asylum-and-town pairs from the second research batch are added, but kept at moderate: the census occupation counts show large state-wide trade pools, which weakens the 'no one to build it' part of the mismatch. The size-versus-town gap itself stands.
- State census counts show sizeable trade pools in most pair states (e.g. Kansas 2,999 masons and stonecutters in 1880 while Topeka's capitol was going up; Michigan 4,412 in 1880 for Lansing and Traverse City). A state-funded building could draw on those pools, so a small town population on its own is not a labour gap.
Crews and the census
- Texas State CapitolAustin
- Texas, 1880: 1,668 brick and stone masons, marble and stone cutters in the whole state (1880 Table XXXIV, printed p. 847). 86 imported cutters = 5.2% of that count.
- Texas, 1900: 426 marble and stone cutters statewide (1900 Table 32). 86 = 20.2% of the 1900 cutters, twelve years after the capitol was finished.
Texas did have stoneworkers (1,668 masons and cutters in 1880), yet the builders still brought 86 cutters from Scotland. That fits a shortage of granite cutters specifically, not of masons in general.
- Biltmore HouseAsheville, North Carolina
- North Carolina, 1900: 1,756 masons (brick and stone) and 415 marble and stone cutters statewide (1900 Table 32). 60 stonemasons = 3.4% of the state's 1900 masons. (1890 North Carolina figures not sourced.)
- Biltmore is Indiana limestone, not brick, so no brick-rate estimate is made.
A crew of 60 is a small share of the state's masons.
- Trans-Allegheny Lunatic AsylumWeston, West Virginia
- West Virginia, 1880: 1,059 brick and stone masons, marble and stone cutters statewide; Weston itself had 1,516 people (1880 census, https://en.wikipedia.org/wiki/Weston,_West_Virginia). Weston town counts not sourced.
- West Virginia, 1900: 1,626 masons and 499 marble and stone cutters statewide.
No crew size is recorded, so no ratio can be made.
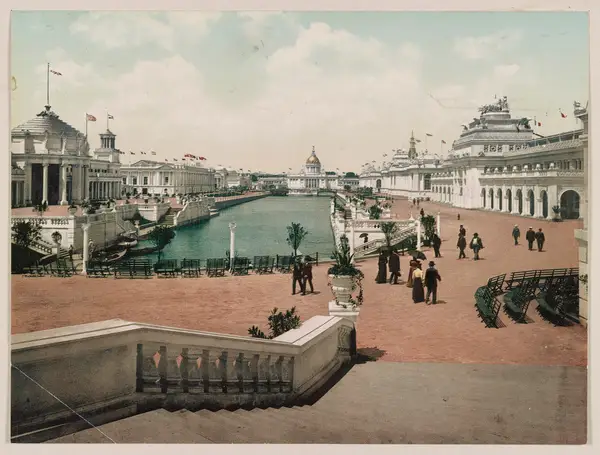 Trans-Mississippi and International ExpositionOmaha 1898
- Omaha city, 1900 (males): 1,364 carpenters and joiners, 423 masons (brick and stone), 139 plasterers, 94 marble and stone cutters, 244 iron and steel workers (1900 Table 43, printed pp. 664 and 666).
- Nebraska, 1900: 7,329 carpenters, 1,701 masons, 692 plasterers statewide.
The fair palaces were staff (plaster and fibre) over frames, so carpenters and plasterers are the relevant trades. Without a recorded crew size there is nothing to divide.
31 census counts, by state and city
California 1880
9,056 carpenters1,565 masons and stonecutters1,099 iron and steel workers
Tenth Census of the United States (1880), Vol. 1, Statistics of the Population, p. 811 ↗Colorado 1880
3,773 carpenters1,166 masons and stonecutters177 iron and steel workers
carpenters: first digit 3 or 8 is hard to tell apart in this scan; 3,773 is read, and fits Colorado's 1900 figure of 5,592
Tenth Census of the United States (1880), Vol. 1, Statistics of the Population, p. 812 ↗Illinois 1880
22,972 carpenters7,535 masons and stonecutters6,283 iron and steel workers
Tenth Census of the United States (1880), Vol. 1, Statistics of the Population, p. 820 ↗Kansas 1880
7,119 carpenters2,999 masons and stonecutters618 iron and steel workers
Tenth Census of the United States (1880), Vol. 1, Statistics of the Population, p. 823 ↗Michigan 1880
16,541 carpenters4,412 masons and stonecutters2,868 iron and steel workers
Tenth Census of the United States (1880), Vol. 1, Statistics of the Population, p. 829 ↗New York 1880
49,754 carpenters23,893 masons and stonecutters16,261 iron and steel workers
Tenth Census of the United States (1880), Vol. 1, Statistics of the Population, p. 839 ↗Ohio 1880
29,770 carpenters10,713 masons and stonecutters13,419 iron and steel workers
Tenth Census of the United States (1880), Vol. 1, Statistics of the Population, p. 841 ↗Oregon 1880
1,899 carpenters312 masons and stonecutters97 iron and steel workers
carpenters: 1,899 read; the 8 could be a 3 in this scan (1,399)
Tenth Census of the United States (1880), Vol. 1, Statistics of the Population, p. 842 ↗Texas 1880
5,693 carpenters1,668 masons and stonecutters155 iron and steel workers
Tenth Census of the United States (1880), Vol. 1, Statistics of the Population, p. 847 ↗West Virginia 1880
3,205 carpenters1,059 masons and stonecutters1,517 iron and steel workers
carpenters: 3,205 read; the first digit could be an 8 in this scan, but 8,205 would be above the 1900 figure of 6,485
Tenth Census of the United States (1880), Vol. 1, Statistics of the Population, p. 852 ↗Arkansas 1900
4,192 carpenters671 masons (brick and stone)639 masons (line only)160 marble and stone cutters102 plasterers181 iron and steel workers
Twelfth Census of the United States (1900), Special Reports: Occupations (1904), p. 98, 100 ↗California 1900
15,916 carpenters1,774 masons (brick and stone)1,661 masons (line only)960 marble and stone cutters736 plasterers3,102 iron and steel workers
Twelfth Census of the United States (1900), Special Reports: Occupations (1904), p. 98, 100 ↗Colorado 1900
5,592 carpenters1,390 masons (brick and stone)1,249 masons (line only)407 marble and stone cutters388 plasterers1,475 iron and steel workers
Twelfth Census of the United States (1900), Special Reports: Occupations (1904), p. 98, 100 ↗Georgia 1900
9,479 carpenters1,914 masons (brick and stone)1,864 masons (line only)964 marble and stone cutters370 plasterers923 iron and steel workers
Twelfth Census of the United States (1900), Special Reports: Occupations (1904), p. 98, 100 ↗Idaho 1900
1,265 carpenters191 masons (brick and stone)186 masons (line only)44 marble and stone cutters42 plasterers37 iron and steel workers
Twelfth Census of the United States (1900), Special Reports: Occupations (1904), p. 99, 101 ↗Kentucky 1900
10,216 carpenters2,359 masons (brick and stone)2,087 masons (line only)699 marble and stone cutters808 plasterers3,889 iron and steel workers
Twelfth Census of the United States (1900), Special Reports: Occupations (1904), p. 99, 101 ↗Lincoln, Nebr. 1900 · city · males
481 carpenters168 masons (brick and stone)52 plasterers
Twelfth Census (1900), Special Reports: Occupations (1904), p. 449 ↗Minnesota 1900
15,191 carpenters4,061 masons (brick and stone)3,940 masons (line only)1,139 marble and stone cutters804 plasterers1,889 iron and steel workers
Twelfth Census of the United States (1900), Special Reports: Occupations (1904), p. 99, 101 ↗Mississippi 1900
4,475 carpenters694 masons (brick and stone)663 masons (line only)41 marble and stone cutters76 plasterers154 iron and steel workers
Twelfth Census of the United States (1900), Special Reports: Occupations (1904), p. 99, 101 ↗Missouri 1900
21,540 carpenters6,147 masons (brick and stone)5,356 masons (line only)1,520 marble and stone cutters1,966 plasterers5,440 iron and steel workers
Twelfth Census of the United States (1900), Special Reports: Occupations (1904), p. 108, 110 ↗Montana 1900
2,831 carpenters572 masons (brick and stone)535 masons (line only)138 marble and stone cutters141 plasterers260 iron and steel workers
Twelfth Census of the United States (1900), Special Reports: Occupations (1904), p. 108, 110 ↗Nebraska 1900
7,329 carpenters1,701 masons (brick and stone)1,614 masons (line only)284 marble and stone cutters692 plasterers472 iron and steel workers
Twelfth Census of the United States (1900), Special Reports: Occupations (1904), p. 108, 110 ↗North Carolina 1900
8,067 carpenters1,756 masons (brick and stone)1,658 masons (line only)415 marble and stone cutters259 plasterers458 iron and steel workers
Twelfth Census of the United States (1900), Special Reports: Occupations (1904), p. 108, 110 ↗Omaha, Nebr. 1900 · city · males
1,364 carpenters423 masons (brick and stone)94 marble and stone cutters139 plasterers244 iron and steel workers
Twelfth Census (1900), Special Reports: Occupations (1904), p. 664, 666 ↗Oregon 1900
4,357 carpenters573 masons (brick and stone)541 masons (line only)155 marble and stone cutters164 plasterers455 iron and steel workers
Twelfth Census of the United States (1900), Special Reports: Occupations (1904), p. 109, 111 ↗Seattle, Wash. 1900 · city · males
left blank: this column is too faint in the census.gov scan to read single digits (carpenters 1,8?0, masons 2?0, plasterers 11?)
Twelfth Census (1900), Special Reports: Occupations (1904), p. 469 ↗Springfield, Ill. 1900 · city · males
145 masons (brick and stone)48 plasterers
carpenters left blank: the scan reads 608, 603 or 508
Twelfth Census (1900), Special Reports: Occupations (1904), p. 469 ↗Texas 1900
12,433 carpenters2,020 masons (brick and stone)1,909 masons (line only)426 marble and stone cutters242 plasterers745 iron and steel workers
Twelfth Census of the United States (1900), Special Reports: Occupations (1904), p. 109, 111 ↗Topeka, Kans. 1900 · city · males
609 carpenters137 masons (brick and stone)52 plasterers
faint print; column order on the page is Taunton, Terre Haute, Toledo, Topeka
Twelfth Census (1900), Special Reports: Occupations (1904), p. 473 ↗Washington 1900
7,671 carpenters1,036 masons (brick and stone)1,014 masons (line only)238 marble and stone cutters345 plasterers596 iron and steel workers
Twelfth Census of the United States (1900), Special Reports: Occupations (1904), p. 109, 111 ↗West Virginia 1900
6,485 carpenters1,626 masons (brick and stone)1,564 masons (line only)499 marble and stone cutters354 plasterers2,200 iron and steel workers
Twelfth Census of the United States (1900), Special Reports: Occupations (1904), p. 109, 111 ↗
What the census volumes could not tell us
Town- or county-level counts for the small towns (Weston, Athens, Fergus Falls, Traverse City, Ovid/Willard, Napa, Salem OR, Milledgeville, Lansing, Austin, Jackson, Boise, Olympia, Helena, Frankfort, Jefferson City, Leadville, Asheville) in any year 1850–1900
The printed census volumes only break occupations down by city for the largest cities (1870 and 1880: 50 principal cities; 1890: cities of 25,000+ in Table 118; 1900: cities of 25,000+ in Table 42). None of these towns was big enough. County counts would need IPUMS full-count microdata, which needs an account, so they are left blank.
1850, 1860 and 1870 state counts
The 1870 census.gov PDFs we downloaded (1870a-34 to 40) have no text layer and were not read page by page in this pass; 1850 and 1860 volumes were not downloaded. Left blank.
1890 state and city counts
The 1890 Population Part II volumes were downloaded, but their state occupation tables did not come through in the text layer and were not read from images in this pass. Table 118 (cities of 50,000+) is in section 5; of the pair towns only Omaha and Lincoln were that size in 1890, and the table was not read from images in this pass. Left blank.
Seattle 1900 city counts; Springfield 1900 carpenters
Too faint in the census.gov scan to read every digit (see 'legibility').
Stone carvers and bricklayers as separate trades
Neither is its own line in these tables: bricklayers fall inside 'Masons (brick and stone)', and carvers are not split out from 'Marble and stone cutters'. Left blank rather than guessed.
UK and Canada equivalents (e.g. Holloway Sanatorium, Colney Hatch, Ottawa, Victoria BC)
Not sourced in this pass. Left blank.
Where it happened 42 places
Open the globe ›Land: Natural Earth (public domain).
Patterns
The same story turns up in other threads.
 Hypotheses20 patterns across all the threads
 Clues Others Missed110 details in the photos
 Mud FloodBuried first floors, raised streets and what lies under the cities
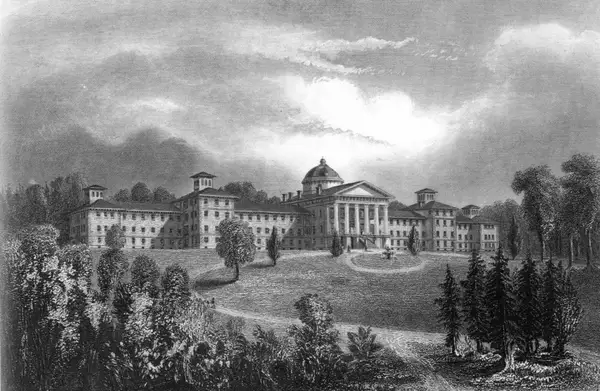 AsylumsKirkbride palaces and why admissions soared
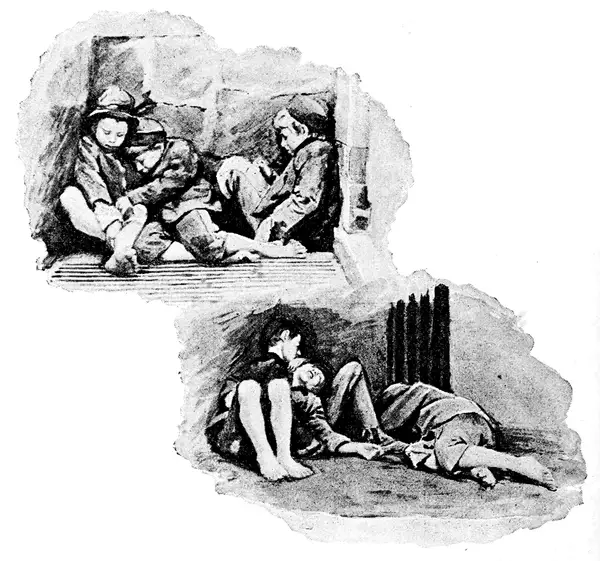 Orphan TrainsAbout 200,000 children sent west, 1854–1929
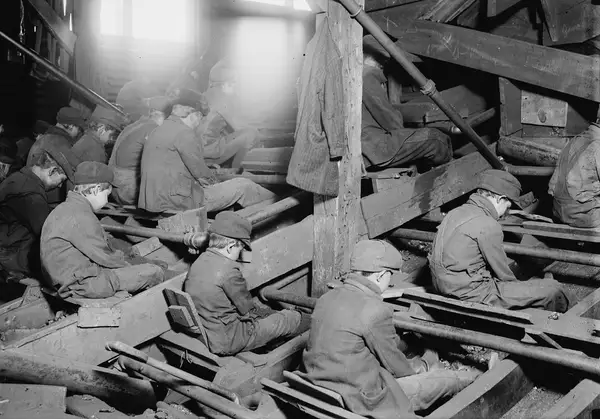 Child Labor & RepopulationBreaker boys, mill girls and the 1850–1920 window
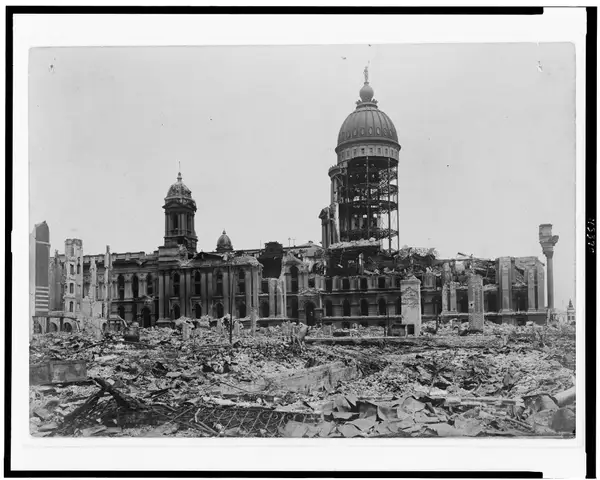 Burned and Rebuilt?Ruins, then palaces: swipe between the two photos
 Same Story, Different CityFire, temporary, rebuilt: the same beats in city after city
 Architects of RecordWho got the credit, how old they were, and how long it took
 Catacombs & UndergroundCatacombs, ossuaries, underground cities and forgotten tunnels under the cities